Sterling Investment Services for all your stock and options trading needs. Stock Tips

Stock and Option Trading Ideas
 
Loading

Market Data and Free Tools

Markets Overview
Market Momentum
Nada
Commodities
52 Week Highs
52 Week Lows
Volume Leaders
Price Advances
Price Declines
Percent Advances
Percent Declines

Symbol Lookup
Custom Quotes
Custom Portfolio


Free Newsletter

Join our mailing list
and receive our FREE Weekly Newsletter!

subscribe unsubscribe

Interested in reselling the Sterling Investment Services Prime Stock Newsletter or referring subscribers and earning extra income?? (more)

New Features - Coming Soon

Daily Market Commentary Daily Long or Short Stock Recommendation and our option recommendation. Select Fundamental Info. Our Technical Analysis of the Stock!

If you think traders & investors find this information useful then you should be one of our affiliates!


Announcements

Sterling Small Cap Letter.

Sterling Investment Services is now publishing our Small Cap Review newsletter that highlights small and micro cap companies that we should be of interest to our readers. Additional information on the Small Cap. Review can be found (here).


www.sterlinginvestments.com


Sterling Weekly for the Week of May 17th, 2010
Flash Crash and the Market Direction

Since the previous edition of the Sterling Weekly, the Dow Jones Industrial Average lost 584.12 points or approximately 5.2%, to finish at 10,620.16 It has been 3 weeks since the previous edition of the Sterling Weekly, and the market has definitely had a little bit of a rough ride since late April; with what appears to be the start of a new downward trend in the overall market and the "flash crash" a couple of Thursdays ago.

My thoughts on the "flash crash" is that it was primarily due to changes in the market cause by decimalization in the late '90s. The end of quoting stocks in fractions and quoting them in pennies narrowed the spreads which resulted in basically the end of the market maker and specialist system and gave rise to a new form of market liquidity which is dominated by a few high frequency trading firms. As a result, there are fewer firms willing to take in inventory and in the process help stabilize the market. Additionally the decentralization of trading by moving a greater percentage of the trading away from the exchanges that actually "list" the securities accelerated the down draft by not having all the exchanges follow the same rules. A good example of this is the circuit breakers that apply to 1 exchange but not all the others. At the end of the day, I do not think the "flash crash" was a result of a failure of the system, but the regulations that govern the system.

In looking at the market the big question is where are things going from here. In my review of the broad market and the various sector indices I track they all appear to have broken to the downside. Almost all of them have broken below there 40 day moving averages and appear to be heading towards their 200 day moving averages, with a handful having broken below their 200 day moving averages. This is definitely a bearish sign. Personally I think the market is doing this because the bailout in the European Union looks to me to be a combination of kicking the proverbial can down the road and some form of a Ponzi scheme. In addition to this the declining Euro is probably tipping the scales towards slower worldwide growth and lower earnings for our multi-national corporations; which at the end of the day combined with the talk of higher taxes here will lead to lower US economic growth.

So, where do I see the overall market going? Well in the August 24th, 2009 edition of the Sterling Weekly with the Dow Jones Industrial Average having closed the Friday before at 9,505.96, I looked at the retracement numbers for the rally the rally that was well under way. I thought that these numbers would be relevant because I felt that due to the economic conditions facing the country that the US was entering a long term secular bear market. To me this meant primarily two (2) things. The 1st being that the overall market was unlikely to reach its old all-time high anytime soon; and secondly and more importantly, once the market had finished retracing its downward movement it would most likely start a new and rather prolonged downward trend. This new downward trend would be rather painful to those who were caught unprepared.

In the August 24th, 2009 edition of the Sterling Weekly, I stated that I thought a 1/3 to 2/3rds retracement would cause the Dow Jones Industrial Average to rally somewhere between 9,086.21 to 11,625.37. In the January 25th edition of the Sterling Weekly, I asked if we had completed the 3rd leg upwards in the retracement rally. While I may have been somewhat premature in calling the for the completion of that 3rd leg, it doesn't mean the market won't still head lower following the completion of that 3rd leg. Well, I have updated my chart on the Dow Jones Industrial Average to reflect what I consider to be the 3rd upward leg to the 2009 retracement rally. I have inserted that chart below for your review.

Dow Jones Industrial Average

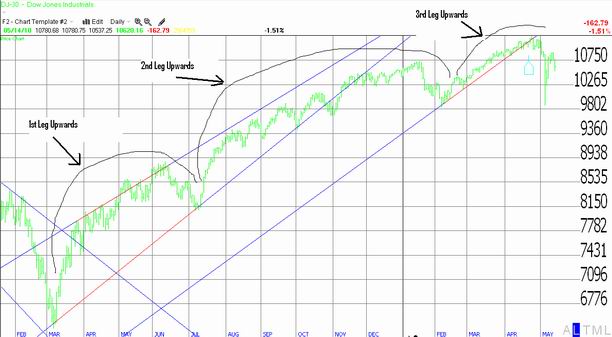
If I am correct in my analysis, the numbers I have put together look something like this. The market bottomed out on March 9th, 2009 at 6,547.05. The market appears to have peaked out at 11,205.03 on April 26th for an upward movement of 4,657.98 A 1/3 retracement of this move upwards would be 1,552.66 point which would take the Dow Jones Industrial Average down to 9,652.37. A 2/3rd retracement of the rally would take the Dow Jones Industrial Average down to 8,099.71

In my opinion a retracement is a normal and healthy part of the market, even if it a move downwards that retraces a market rally. The question that really comes crucial is if we are in a secular bear market, are we going to seriously test the lows from the spring of 2009 or possibly push through them to lower levels. Sound crazy??? Maybe, but if you think there is a realistic possibility that the US economy will double dip in 2011 following the expiration of the Bush tax cuts then maybe it is not so crazy after all.......?


Sterling Calendars for the Week of May 17th, 2010.
Economic Calendar

Date

Est. Time Release

For

Consensus Prior
05/17 9:00am Net Long-Term TIC Flows Feb 40.0 47.1
05/18 8:30am Building Permits Apr. 680K 680K
05/18 8:30am Core PPI Apr. 0.1% 0.1%
05/18 8:30am PPI Apr. 0.1% 0.7%
05/18 8:30am Housing Starts Apr. 656K 626K
05/19 8:30am Core CPI Apr. 0.0% 0.0%
05/19 8:30am CPI Apr. 0.1% 0.1%
05/19 10:30am Crude Inventories 05/15   1.95M
05/20 8:30am Continuing Claims 05/15 4,600K 4,627K
05/20 8:30am Initial Claims 05/15 440K 444K
05/20 10:00am Leading Indicators Apr. 0.2% 1.4%
05/20 10:00am Philadelphia Fed. May 21.3 20.2
  Misc. Calendar
Date: Comments:
05/17 Lowe's 'LOW' announces earnings before the open. est. $0.31
05/17 Agilent 'A' announces earnings after the close. Est. $0.41
05/18 Home Depot 'HD' announces earnings before the open. Est. $0.40
05/18 Wal-Mart 'WMT' announces earnings before the open. Est. $0.85
05/18 Hewlett-Packard 'HPQ' announces earnings after the close. Est. $1.05
05/19 Deere 'DE' announces earnings before the open. Est. $1.09
05/19 Polo Ralph Loren 'RL' announces earnings before the open. Est. $0.64
05/19 Advance Auto 'AAP' announces earnings after the close. Est. $1.00
05/19 Applied Materials 'AMAT' announces earnings after the close. Est. $0.21
05/19 Limited 'LTD' announces earnings after the close. Est. $0.19
05/20 Dollar Tree 'DLTR' announces earnings before the open. Est. $0.83
05/20 Ross Stores 'ROST' announces earnings before the open. Est. $1.15
05/20 Target 'TGT' announces earnings before the open. Est. $0.86
05/20 Williams-Sonoma 'WSM' announces earnings before the open. Est. $0.11
05/20 Aeropostale 'ARO' announces earnings after the close. Est. $0.46
05/20 Dell Computer 'DELL' announces earnings after the close. Est. $0.26
05/20 Gap, Inc. 'GPS' announces earnings after the close. Est. $0.43
05/20 Sears Holdings 'SHLD' announces earnings after the close. Est. $0.14
05/20 Intuit 'INTU' announces earnings after the close. Est. $1.82
05/21 Ann Taylor 'ANN' announces earnings before the open. Est. $0.35
  The full earnings calendar for this week can be found (here)

Prime Update:

The Prime Stock Newsletter is our daily newsletter that contains commentary on the overall market, and our single best trading idea for the day! (Both Long & Short Sale Recommendations) We select this stock through a combination of technical (charting) and fundamental (financial) analysis. The Prime Stock Newsletter provides select expanded quotation information, corporate description, select recent company news, our technical analysis of the shares and our expectations, and our options recommendation for the company.

Our most recent Performance Report is now available available (here). We are proud to report 13 of our last 16 recommendation resulted in profitable trades for an average profit of $0.39/share. This is an 81.25% success rate.

Archived copies of our Performance Reports can be found (here).

Highlights from Recent (20) Editions of the Prime Stock Newsletter
Recommendation Date Entry Point Recent Close or Exit Price Profit* Note
Petroleo Brasil 'PBR' short May 4 $40.05 $38.38 $1.67 Covered on the 4th
Dr. Pepper 'DPS' May 12 $37.40 $38.90 $1.50 Sold on the 13th
Baxter Int'l 'BAX' short May 13 $44.72 $43.16 $1.56 Covered on the 14th

* On April 22nd we originally recommended the short sale of Abbott Laboratories 'ABT' @ $51.78/share. It was also our short sale recommendation again on May 14th @ $48.61/share.

* Our April 20th short sale recommendation of American Tower 'AMT' @ $41.54/share, closed at $38.66/share on May 7th for a gain of $2.88/share.

* Our April 16th short sale recommendation of Merck & Co. 'MRK' @ $36.04/share, closed @ $32.88/share on May 14th for a gain of $3.16/share.

* The per share PROFIT is a theoretical calculation based upon the opening price the day the recommendation is published and the intra day high (or low for short sales) on the exit day. The exit day is determined based upon the application of our "Rules for Trading", the implementation of "stops" within our stated policy, and may not reflect the complete or full movement of the underlying recommendation.


Disclaimer: The Sterling Investments series of newsletters is produced by Sterling Investment Services, Inc. All information used in the production has been obtained from sources believed to be reliable and accurate. Sterling Investment Services does not warrant or assume any liability for inaccuracy of the information used to produce our publications. To receive further information on these services please visit our web page at: www.sterlinginvestments.com If you would like to contact us our fax # is (404)-816-8830 Email address is: enelson@sterlinginvestments.com Sterling Investment Services may hold positions in the securities recommended or may be providing consulting services to the companies mentioned within this report.
©1999 - 2010 Copyrighted, All Rights Reserved