Daily Market Commentary
Daily Long or Short
Stock Recommendation
and our option recommendation.
Select Fundamental
Info. Our Technical
Analysis of the Stock!
If you think traders & investors find
this information useful
then you should be
one of our affiliates!
Announcements
Sterling Small Cap Letter.
Sterling Investment Services is now publishing our Small Cap Review newsletter that highlights small and micro cap companies that we should be of interest to our readers. Additional information on the Small Cap. Review can be found (here).
Sterling Custom Research
Sterling Investment Services has recently published a small cap. research report on Sun River Energy, Inc. (SNRV.OB). This is a company that we think has some pretty interesting potential. A copy of our report can be found (here).
Sterling Weekly for the Week of January 25th, 2010
Is the Dow pulling back? And to where?
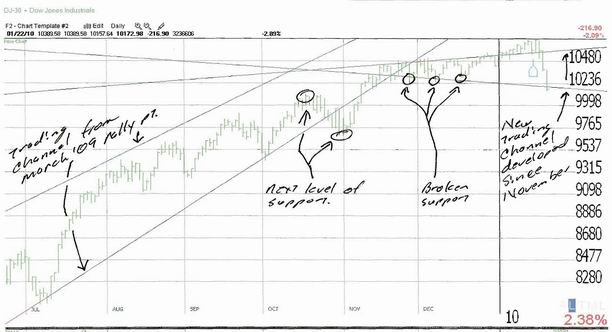
Since the previous edition of the Sterling Weekly, the Dow Jones Industrial Average declined 436.67 points or approximately 4.1%, to finish at 10,172.98 The Dow lost approximately 430 points in the final 2 days of trading last week. The market pullback was primarily ignited by new proposed regulation on the banking industry that are perceived as causing banks to tighten credit. Additionally the uncertainty over the confirmation of Fed. Chairman Ben Bernanke whose term as Chairman of the Fed. effectively expires at the end of this week. Regardless of the cause, the fact of the matter is that the Dow Jones Industrial Average appears to be in the process of braking, if it hasn't already done so, its upward trend that has been in place since March of last year. So I thought it would be relevant to take a look at where support comes into play on the Dow and see what that might tell us, as it is important to know if this is just a short term pullback or the start of a new downward trend.
I've inserted below a short term chart of the Dow Jones Industrial Average that shows the Dow breaking below 3 points of support that have been established since mid-November. The next points of downside support are at 10,092.19 and 9,712.73, as indicated on the chart. You can also see on the chart the trading channel that has been developing since mid-November. (Note: I 1st published a chart showing this trading channel in the December 28th, 2009 edition of the Sterling Weekly with a note stating there was an increasing chance of a pullback.)
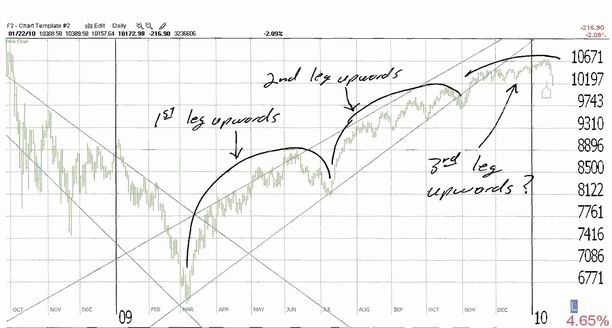
Now I believe the trading activity on Monday and Tuesday will really determine if this is a short term pullback or the start of a new downward trend. I see one of two possible scenarios developing. By the close of trading on Tuesday the market has rallied and in effect re-enforced the trading channel that has been developing since mid-November and we are going to see an increasingly volatile market. Or, the market is even lower by the close of Tuesday and we have broken the upward trendline that has been in effect since March and started a new move downwards. In a typical market movement there is the belief that a run will have three (3) legs to it. I'll be the 1st to admit that defining these legs can easily be more of an art than a science; but if we have experienced 3 upward legs, then the odds of a major pullback are fairly strong. I've published a slightly longer term chart of the Dow Jones Industrial Average below showing what I think would be the three (3) upward movements since the March 2009 lows in the market.
If I am correct, and we have seen the three (3) upward movements and are starting a new downward trend, then the question is how far down could we go? Well, in the August 24th edition of the Sterling Weekly I published the Fibonacci Retracement numbers on the decline where I forecast an upwards move on the Dow Jones Industrial Average to somewhere between the 9,086 and 11,625. Additionally in the November 23rd, 2009 edition of the Sterling Weekly I stated that we were entering an area of upside resistance that could make further advances in the Dow tougher to come by. Well, if the current upward movement is over, then Dow rally peaked with a closing high of 10,725.43 on January 19th of this year. That would represent a rally upward of approximately 4,178.38 points from the closing low of 6,547.05 set in March of last year. Since a typical retracement is somewhere between 1/3 and 2/3rds of the move being retraced, then a 1/3rd retracement would take the Dow down to 9,332.64 and a 2/3rds retracement would take the Dow down to 7,939.84. Again I would like to point out that the media likes to focus on a 50% retracement as the most likely occurrence, so a 50% retracement would be to 8,636 which is where there appears to have been a lot of previous activity and an area on the chart where the Dow could find itself stuck for a time.
Sterling
Calendars for the Week of January 25th, 2010.
AK Steel Holdings 'AKS' reports earnings at 8:30am. Est. $0.21
01/25
Amgen 'AMGN' announces earnings after the close. Est. $1.16
01/25
Apple, Inc. 'AAPL' announces earnings after the close. Est. $2.07
01/25
Eaton Corp. 'ETN' announces earnings before the open. Est. $1.23
01/25
Haliburton Co. 'HAL' announces earnings before the open. Est. $0.27
01/25
Texas Instruments 'TXN' announces earnings at 4:30pm Est. $0.49
01/26
Baker Hughes 'BHI' announces earnings before the open. Est. $0.35
01/26
Corning 'GLW' announces earnings before the open. Est. $0.42
01/26
Delta Airlines 'DAL' announces earnings before the open. Est. ($0.24)
01/26
Johnson & Johnson 'JNJ' announces earnings. Time N/A. Est. $0.97
01/26
Verizon 'VZ' announces earnings before the open. Est. $0.55
01/26
US Steel 'X' announces earnings. Time N/A. Est. ($1.43)
01/26
Yahoo, Inc. 'YHOO' announces earnings after the close. Est. $0.11
01/27
Abbot 'ABT' announces earnings before the open. Est. $1.17
01/27
Airtran Holdings 'AAI' announces earnings. Time N/A. Est. $0.03
01/27
BMC Software 'BMC' announces earnings. Time N/A. Est. $0.68
01/27
Caterpillar, Inc. 'CAT' announces earnings at 7:30am Est. $0.28
01/27
ConocoPhillips 'COP' announces earnings at 8:30am Est. $1.13
01/27
General Dynamics 'GD' announces earnings. Time N/A. Est. $1.57
01/27
Boeing Co. 'BA' announces earnings at 7:30am. Est. $1.36
01/28
3M Company 'MMM' announces earnings. Time N/A. Est. $1.21
01/28
Amazon.com 'AMZN' announces earnings after the close. Est. $0.72
01/28
AT&T 'T' announces earnings. Time N/A. Est. $0.51
01/28
Ford Motor 'F' announces earnings at 7:00am Est. $0.26
01/28
KLA-Tencor 'KLAC' announces earnings after the close. Est. $0.27
01/28
Microsoft 'MSFT' announces earnings after the close. Est. $0.59
01/29
Chevron 'CVX' announces earnings . Time N/A. Est. $1.71
01/29
Honeywell ''HON' announces earnings before the open. Est. $0.90
01/29
Mattel 'MAT' announces earnings before the open. Est. $0.68
The
full earnings calendar for this
week can be found (here)
Prime
Update:
The Prime Stock Newsletter is our daily newsletter that contains commentary on the overall market, and our single best trading idea for the day! (Both Long & Short Sale Recommendations) We select this stock through a combination of technical (charting) and fundamental (financial) analysis. The Prime Stock Newsletter provides select expanded quotation information, corporate description, select recent company news, our technical analysis of the shares and our expectations, and our options recommendation for the company.
Our most recent Performance Report is now available available (here). We are proud to report 18 of our last 20 recommendation resulted in profitable trades for an average profit of $0.51/share. This is an 90% success rate.
* Our January 19th short sale recommendation of Western Digital 'WDC' @ $43.98/share, closed at $40.74/share Friday January 22nd for a gain of $3.24/share.
* Our January 13th short sale recommendation of Texas Inst. 'TXN' @ $24.91/share, closed at $23.11/share Friday January 22nd for a gain of $1.80/share.
* Our January 12th short sale recommendation of Best Buy, Inc. 'BBY' @ $39.23/share, closed at $37.15/share Friday January 22nd, 2010 for a gain of $2.08/share.
* Our December 23rd recommendation of Patriot Coal 'PCX' @ $14.90/share, reached an intra-day high of $22.37/share on January 11th for a gain of $7.47/share.
* The
per share PROFIT is a theoretical
calculation based upon the opening
price the day the recommendation is
published and the intra day high (or
low for short sales) on the exit day.
The exit day is determined based upon
the application of our "Rules
for Trading", the implementation
of "stops" within our stated
policy, and may not reflect the complete
or full movement of the underlying
recommendation.
Disclaimer:
The Sterling Investments series of newsletters is produced by Sterling
Investment Services, Inc. All information
used in the production has been obtained
from sources believed to be reliable and
accurate. Sterling Investment Services
does not warrant or assume any liability
for inaccuracy of the information used
to produce our publications. To receive
further information on these services
please visit our web page at: www.sterlinginvestments.com
If you would like to contact us our fax
# is (404)-816-8830 Email address is:
enelson@sterlinginvestments.com Sterling
Investment Services may hold positions
in the securities recommended or may be
providing consulting services to the companies
mentioned within this report.