Sterling Investment Services for all your stock and options trading needs. Stock Tips

Stock and Option Trading Ideas
 
Loading

Market Data and Free Tools

Markets Overview
Market Momentum
Nada
Commodities
52 Week Highs
52 Week Lows
Volume Leaders
Price Advances
Price Declines
Percent Advances
Percent Declines

Symbol Lookup
Custom Quotes
Custom Portfolio


Free Newsletter

Join our mailing list
and receive our FREE Weekly Newsletter!

subscribe unsubscribe

Interested in reselling the Sterling Investment Services Prime Stock Newsletter or referring subscribers and earning extra income?? (more)

New Features - Coming Soon

Daily Market Commentary Daily Long or Short Stock Recommendation and our option recommendation. Select Fundamental Info. Our Technical Analysis of the Stock!

If you think traders & investors find this information useful then you should be one of our affiliates!


Announcements

Sterling Small Cap Letter.

Sterling Investment Services is now publishing our Small Cap Review newsletter that highlights small and micro cap companies that we should be of interest to our readers. Additional information on the Small Cap. Review can be found (here).


Sterling Custom Research

Sterling Investment Services has recently published a small cap. research report on Sun River Energy, Inc. (SNRV.OB). This is a company that we think has some pretty interesting potential. A copy of our report can be found (here).


www.sterlinginvestments.com


Sterling Weekly for the Week of February 8th, 2010
The Market and the Future

Since the previous edition of the Sterling Weekly, the Dow Jones Industrial Average lost 173.30 points or approximately 1.7%, to finish at 10,012.23 Starting early last fall I began having conversations with my wife concerning further advancement in the overall market in 2010, and in late November of last year I began to voice those concerns to my readers starting with the November 23rd edition of the Sterling Weekly; and in the January 25th, 2009 edition of the Sterling Weekly I stated that I thought the Dow Jones Industrial Average could test 9,712.73 on a closing basis. While I will admit I was not expecting this sharp of a pullback, the fact of the matter remains that we are in the process of experience some sort of a pullback. The question becomes is this a short term pullback or the start of a larger downward trend.

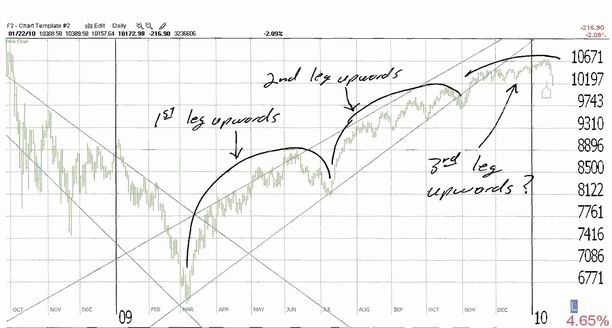
In the January 25th, 2009 edition of the Sterling Weekly I published the chart below showing what I thought were the three upward legs to the market rally that started in March of last year. The question concerning that 3rd leg upwards is when do you consider it to be broken? I think the close on the Dow below 10,092.19 signal the breaking of the 3rd leg of the upward trend. My thoughts are that the Dow Jones Industrial Average is going to continue to move lower and test 9,712.73 on a closing basis. If the Dow closes below that level, then I see the next point of support coming into play on the Dow at 9,487.67

Dow Jones Industrial Average

For as long as I have been writing I've said that politics is the number one influence on the market. I really hate to say it, or in this case write it, but I really feel that the market is pulling back as a result of the bad policy proposals and decisions coming out of Washington. I really wish the market was doing better and I was writing about another sector index that was looking good; but the market isn't doing well and all the sector indices I track look to be moving lower. I don't feel like getting into a lot of details on what I think is going wrong with the policy decisions. Maybe I'll put that in one of my blogs, or in another edition of the Sterling Weekly. However I feel like we are going to relive the Carter years, when Jimmy Carter was President. So I thought I would include a chart of the market during the Carter years.

The Market During the Carter Presidency

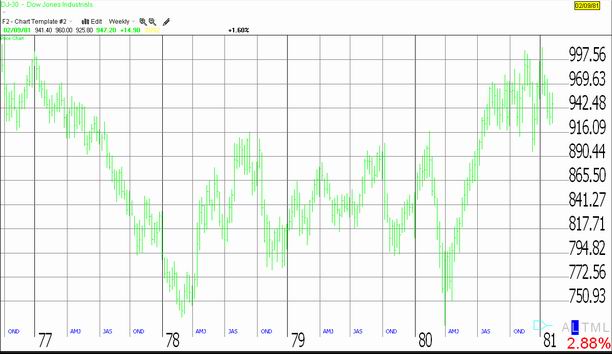
Let's not forget that the Carter presidency was marked by unpopular policy decisions including the Panama Canal Treaty, foreign policy set backs including the Iranian Revolution, the Iranian Hostage Crisis, and the poor economic decisions including the Windfall Profits Tax, and the Russian Grain Embargo. This all helped contribute to a period marked by rising inflation and stagnate economic growth, hence the term stagflation. My concerns are that this go around this could be worse than they were in the late '70's. Time will tell.


Sterling Calendars for the Week of February 8th, 2010.
Economic Calendar

Date

Est. Time Release

For

Consensus Prior
02/09 10:00am Wholesale Inventories Dec. 0.6% 1.5%
02/10 8:30am Trade Balance Dec ($35.0B) ($36.4B)
02/10 10:30am Crude Inventories Feb 5th. N/A 2.32M
02/10 2:00pm Treasury Budget Jan. ($60.0b) ($91.9B)
02/11 8:30am Initial Claims 02/06 N/A N/A
02/11 8:30am Continuing Claims 02/06 N/A N/A
02/11 8:30am Retail Sales Jan. 0.4% (0.3%)
02/11 8:30am Retail Sales Ex.-Auto Jan. 0.4% (0.2%)
02/11 10:00am Business Inventories Dec. 0.4% 0.4%
02/12 9:55am Michigan Sentiment Feb. 74.8 74.4
  Misc. Calendar
Date: Comments:
02/08 Genesee&Wyoming 'GWR' announces earnings. Time N/A. Est. $0.37
02/08 Hartford Financial Services 'HIG' announces earnings after the close. Est. $1.35
02/08 The Principal Group 'PFG' announces earnings after the close. Est. $0.65
02/09 Alfa Natural Resources 'ANR' announces earnings before the open. Est. $0.45
02/09 Coventry Health 'CVH' announces earnings before the open. Est. $0.56
02/09 Lions Gate Entertainment 'LGF' announces earnings after the close. Est. ($0.24)
02/09 Walt Disney 'DIS' announces earnings at 4:01pm ET. Est $0.39
02/10 Boston Scientific 'BSX' announces earnings after the close. Est. $0.13
02/10 Intercontinental Exchange 'ICE' announces earnings before the open. Est. $1.14
02/11 Louisana-Pacific 'LPX' announces earnings before the open. Est. ($0.19 )
02/11 Allstate 'ALL' announces earnings after the close. Est. $1.01
02/11 AutoNation 'AN' announces earnings before the open. Est. $0.27
02/11 BorgWarner 'BWA' announces earnings. Time N/A. Est. $0.22
02/11 Pepsi 'PEP' announces earnings at 7:00am Est. $0.91
02/12 Ultra Petroleum 'UPL' announces earnings. Time N/A. Est. $0.47
  The full earnings calendar for this week can be found (here)

Prime Update:

The Prime Stock Newsletter is our daily newsletter that contains commentary on the overall market, and our single best trading idea for the day! (Both Long & Short Sale Recommendations) We select this stock through a combination of technical (charting) and fundamental (financial) analysis. The Prime Stock Newsletter provides select expanded quotation information, corporate description, select recent company news, our technical analysis of the shares and our expectations, and our options recommendation for the company.

Our most recent Performance Report is now available available (here). We are proud to report 16 of our last 20 recommendation resulted in profitable trades for an average profit of $0.26/share. This is an 80% success rate.

Archived copies of our Performance Reports can be found (here).

Highlights from Recent (20) Editions of the Prime Stock Newsletter
Recommendation Date Entry Point Recent Close or Exit Price Profit* Note
Fibria Celulose 'FBR' short Jan 14 $22.63 $20.02 $1.19 Covered on the 15th
Capital One 'COF' short Jan 26 $35.96 $35.15 $0.81 Covered on the 26th
Suncor Energy 'SU' Feb 03 $31.24 $30.25 $0.99 Covered on the 3rd


* Our January 22nd short sale recommendation of NetApp 'NTAP' @ $31.78/share, reached our stated price target of $30.81/share on January 25th.

* Our January 20th short sale recommendation of Paychex, Inc. 'PAYX' @ $30.43/share, reached our stated price target of $30.81/share on January 28th.

* Our January 14th short sale recommendation of Fibria Celulose 'FBR' @ $21.59/share, reached our lower stated price target of $17.86/share on January 27th.

* Our January 12th short sale recommendation of Best Buy 'BBY' @ $39.23/share, reached our lower price target of $36.41/share on January 28th.

* The per share PROFIT is a theoretical calculation based upon the opening price the day the recommendation is published and the intra day high (or low for short sales) on the exit day. The exit day is determined based upon the application of our "Rules for Trading", the implementation of "stops" within our stated policy, and may not reflect the complete or full movement of the underlying recommendation.


Disclaimer: The Sterling Investments series of newsletters is produced by Sterling Investment Services, Inc. All information used in the production has been obtained from sources believed to be reliable and accurate. Sterling Investment Services does not warrant or assume any liability for inaccuracy of the information used to produce our publications. To receive further information on these services please visit our web page at: www.sterlinginvestments.com If you would like to contact us our fax # is (404)-816-8830 Email address is: enelson@sterlinginvestments.com Sterling Investment Services may hold positions in the securities recommended or may be providing consulting services to the companies mentioned within this report.
©1999 - 2010 Copyrighted, All Rights Reserved