Sterling Investment Services for all your stock and options trading needs. Stock Tips

Stock and Option Trading Ideas
 
Loading

Market Data and Free Tools

Markets Overview
Market Momentum
Nada
Commodities
52 Week Highs
52 Week Lows
Volume Leaders
Price Advances
Price Declines
Percent Advances
Percent Declines

Symbol Lookup
Custom Quotes
Custom Portfolio


Free Newsletter

Join our mailing list
and receive our FREE Weekly Newsletter!

subscribe unsubscribe

Interested in reselling the Sterling Investment Services Prime Stock Newsletter or referring subscribers and earning extra income?? (more)

New Features - Coming Soon

Daily Market Commentary Daily Long or Short Stock Recommendation and our option recommendation. Select Fundamental Info. Our Technical Analysis of the Stock!

If you think traders & investors find this information useful then you should be one of our affiliates!


Announcements

Sterling Small Cap Letter.

Sterling Investment Services is now publishing our Small Cap Review newsletter that highlights small and micro cap companies that we should be of interest to our readers. Additional information on the Small Cap. Review can be found (here).


www.sterlinginvestments.com


Sterling Weekly for the Week of March 15th, 2010
A Look at the NYSE ARCA Airline Index 'XAL'

Since the previous edition of the Sterling Weekly, the Dow Jones Industrial Average gained 75.95 points or approximately 0.7%, to finish at 10,642.15 The Dow continued its upward move last week, even if it was at a slow pace. In my review of the charts from Friday's trading activity I noticed that the S&P 500 'SPX' set a new yearly high on Friday.

Typically the Dow Jones Industrial Average will be setting new highs as well when the S&P 500 is. Experience has taught me that when the S&P 500 sets a new high, if the Dow doesn't do so as well within a few days, it is usually a precursor to a market pullback. Now we still have a few days to go, and I am not trying to sound any alarms right now; but I would like to point out that the S&P 500's yearly closing high was 1,150.23 set on January 19th, and it closed at 1,150.51 on the 11th of this month. This could potentially be a "double top" of upside resistance. If the next few days are to the downside, then this would tend to support the idea of the formation of a "double top" point of resistance. However if we are up over the course of the next few days, and the Dow confirms the move by closing above 10,725.43, then I would look for the S&P 500 to move towards 1,243.72 on a closing basis.

I should point out that as I finished the writing of this week's Sterling Weekly that I noticed that the S&P 100 'OEX' has not yet set a new yearly high.

In this week's edition of the Sterling Weekly I wanted to take a look at the NYSE ARCA Airline Index 'XAL' which set a new yearly closing high on Friday, closing at 38.36. This makes the NYSE ARCA Index 'XAL' one of the better performing indices over the course of the last 12 months. The 'XAL' tracks the price performance of major U.S. and overseas airlines. The 'XAL' Index was established with a benchmark value of 200.00 on October 21, 1994. I've inserted a recent chart on the 'XAL' below for your review.

NYSE ARCA Airline Index 'XAL'

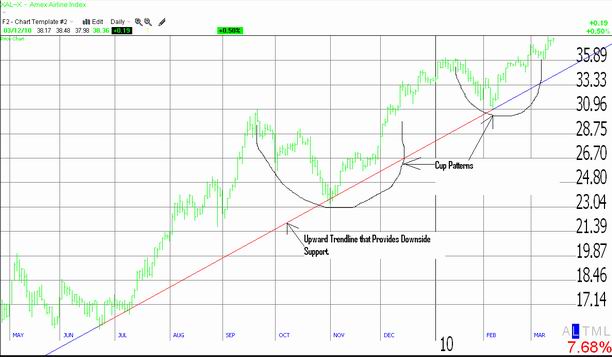
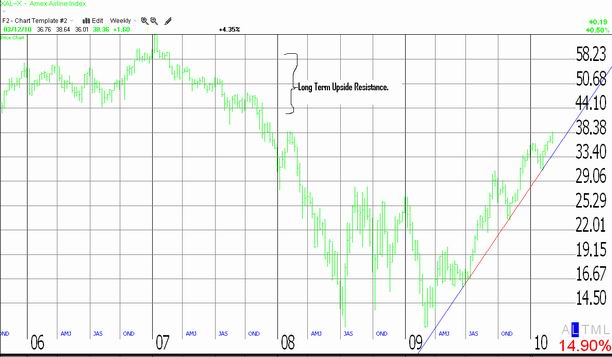
Since coming off its lows in late June of last year, the 'XAL' has established a upward support line that appears to be a major influence on the index. Additionally I have identified a pair of cup patterns on the 'XAL' with the last one providing for a measured move to 40.61 I feel confident with the 'XAL' moving to this level, and a review of the long term chart of the 'XAL' below shows that the 'XAL' should be able to move up to about 43.50 before it starts to see significant upside resistance that will most likely take some significant time to break through.

NYSE ARCA Airline Airline Index 'XAL' longer term

I could only really find one (1) ETF that tracks the NYSE ARCA Airline Index 'XAL', that is the Claymore/NYSE Arca Airline ETF 'FAA.' The Claymore/NYSE ARCA Airline ETF 'FAA' seeks investment results that correspond generally to the performance of the 'XAL.' In comparing the chart of the 'FAA' with the chart of the 'XAL' there is an extremely high correlation between the two, making the 'FAA' an excellent ETF to track the 'XAL.' I calculated a measured move on the 'FAA' to $36.62, considering that Friday it closed at a $35.14, that doesn't leave for much upside. However if we see the 'XAL' make a move to the 43.50 level, then we could see the 'FAA' reach the $41 to $42/share range.

Sterling Calendars for the Week of March 15th, 2010.
Economic Calendar

Date

Est. Time Release

For

Consensus Prior
03/15 8:30am Empire Manufacturing Mar. 22.0 24.91
03/15 9:00am Net Long-Term TIC Flows Dec. $47.5B $63.3B
03/15 9:15am Capacity Utilization Feb. 72.5% 72.%
03/15 9:15am Industrial Production Feb. 0.0% 0.9%
03/16 8:30am Building Permits Feb. 601K 622K
03/16 8:30am Housing Starts Feb. 570K 591K
03/16 8:30am Import Prices Ex.-Oil Feb. N/A 0.4%
03/16 8:30am Export Prices Ex-Ag. Feb. N/A 0.7%
03/16 2:15pm FOMC Rate Decision Mar. 16 0.25% 0.25%
03/17 8:30am Core PPI Feb. 0.1% 0.3%
03.17 8:30am PPI Feb. (0.2%) 1.4%
03/17 10:30am Crude Inventories 03/13 N/A 1.43M
03/18 8:30am Core CPI Feb. 0.1% (0.1%)
03/18 8:30am CPI Feb. 0.1% 0.2%
03/18 8:30am Initial Claims 03/13 450K 462K
03/18 8:30am Continuing Claims 03/06 4,500K 4,558K
03/18 8:30am Current Account Balance Q4 ($120.0B) ($108.0B)
03/18 10:00am Leading Indicators Feb. 0.1% 0.3%
03/18 10:00am Philadelphia Fed. Mar. 18.0 17.6
  Misc. Calendar
Date: Comments:
03/16 Athenahealth, Inc. 'ATHN' announces earnings. Time N/A. Est. $0.17
03/16 Discover Financial Services 'DFS' announces earnings after the close. Est. $0.12
03/16 DSW, Inc. 'DSW' announces earnings at 7:00am Est. $0.32
03/17 Guess, Inc. 'GES' announces earnings after the close. Est. $0.81
03/17 Tootsie Roll 'TR' announces earnings. Est. $0.18 Time N/A.
03/18 FedEx 'FDX' announces earnings. Time N/A. Est. $0.72
03/18 Palm, Inc. 'PALM' announces earnings after the close. Est. ($0.42)
03/18 Ross Stores 'ROST' announces earnings at 8:30am Est. $1.16
03/18 SunPower Corp. 'SPWRA' announces earnings. Time N/A. Est. $0.49
  The full earnings calendar for this week can be found (here)

Prime Update:

The Prime Stock Newsletter is our daily newsletter that contains commentary on the overall market, and our single best trading idea for the day! (Both Long & Short Sale Recommendations) We select this stock through a combination of technical (charting) and fundamental (financial) analysis. The Prime Stock Newsletter provides select expanded quotation information, corporate description, select recent company news, our technical analysis of the shares and our expectations, and our options recommendation for the company.

Our most recent Performance Report is now available available (here). We are proud to report 18 of our last 20 recommendation resulted in profitable trades for an average profit of $0.39/share. This is an 90% success rate.

Archived copies of our Performance Reports can be found (here).

Highlights from Recent (20) Editions of the Prime Stock Newsletter
Recommendation Date Entry Point Recent Close or Exit Price Profit* Note
Suncor Energy 'SU' Feb 03 $31.24 $30.25 $0.99 Covered on the 3rd
Seagate Tech. 'STX' Feb 17 $19.94 $20.94 $1.00 Sold on the 18th.

* Our March 8th recommendation of Williams Sonoma, Inc. 'WSM' @ $23.31/share set a new yearly closing high on March 12th at $24.71/share.

* Our March 3rd recommendation of Intuit, Inc. 'INTU' @ $33.13/share, set a new yearly closing high on March 15th of $34.64/share.

* Our January 29th recommendation of Boeing, Co. 'BA' @ $62.56/share, set a new yearly closing high of $70.01/share on March 10th.

* The per share PROFIT is a theoretical calculation based upon the opening price the day the recommendation is published and the intra day high (or low for short sales) on the exit day. The exit day is determined based upon the application of our "Rules for Trading", the implementation of "stops" within our stated policy, and may not reflect the complete or full movement of the underlying recommendation.


Disclaimer: The Sterling Investments series of newsletters is produced by Sterling Investment Services, Inc. All information used in the production has been obtained from sources believed to be reliable and accurate. Sterling Investment Services does not warrant or assume any liability for inaccuracy of the information used to produce our publications. To receive further information on these services please visit our web page at: www.sterlinginvestments.com If you would like to contact us our fax # is (404)-816-8830 Email address is: enelson@sterlinginvestments.com Sterling Investment Services may hold positions in the securities recommended or may be providing consulting services to the companies mentioned within this report.
©1999 - 2010 Copyrighted, All Rights Reserved