|
|
Sterling
Weekly for August 22nd, 2005
|
Well
last week turned out to be a little
busier than I anticipated, and
as a result I did not get a chance
to find the chart on the price
of oil I was looking for. However
I have been looking at a chart
of Ebay, Inc. 'EBAY' every night
in my review of the charts from
the day's trading activity. The
chart on Ebay has been begging
for my attention. While Ebay has
in the past proven to be a difficult
stock for me to trade personally,
it is developing what I believe
is a pretty clear chart pattern,
sometimes referred to as an "Island"
pattern, with a predictable move
to the downside.
I have included
a chart on Ebay below, and I would
like to direct your attention
to mid July when the shares of
Ebay suddenly gapped higher on
heavier volume, rising to a high
just under $50/share before trending
back lower. This is normally a
very bearish chart pattern, so
let's take a look at the numbers
because the chart indicates that
if we see a downward gap open
in the shares of Ebay, then they
are going to trade under $30/share
in the near future.
|
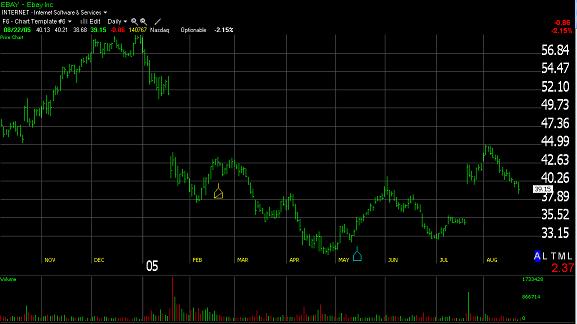
The shares of 'EBAY' closed
July 20th at $34.87/share, and
opened on July 21st at $39.89/share.
Over the course of the next
few days the shares of Ebay
rose to a high of $44.98/share.
Well the rule of thumb is that
the downside price target will
be somewhere between the distance
from the closing price on the
20th to the distance of the
gap open price to the short
term high. This produces a target
range of $24.76-$29.85/share.
As I said earlier Ebay itself
has been a difficult stock for
me to trade, so I don't think
I would open an outright short
position in the shares of Ebay.
But I do think I would create
an Debit Put Spread using the
October puts. Currently the
October $32.50 puts are quoted
at $0.30 by $0.35, and the October
$27.50 Puts are quoted at $0.05
by $0.15/contract. I would would
buy the October $32.50 puts
and sell the October $27.50
puts. This would end up costing
a net $0.30/contract, reducing
my exposure. However it does
limit my potential profit to
the difference between the strike
prices of the 2 contract. So
my potential profit is limited
to $5.00/share on Ebay.
Just my thoughts on where the
shares of Ebay could end up
going to in the next few weeks.
Stay tuned, and I'll be sure
to let you know how it all works
out.
|
|
| Sterling
Calendars for the Week of August 22nd,
2005 |
| Date: |
Comments: |
| 8/22 |
HJ Heinz 'HNZ' reports
earnings before the open. est. $0.49 |
| 8/23 |
Williams-Sonoma
'WSM' reports earnings before the
open. est. $0.25 |
| 8/23 |
Wind River Systems
'WIND' reports earnings, time unknown,
est. $0.06 |
| 8/24 |
Intuit 'INTU' reports
earnings after the close. est. ($0.10) |
| 8/24 |
Petsmart reports
earnings after the close. est. $0.22 |
| 8/24 |
Tivo, Inc. 'TIVO'
reports earnings after the close.
est. ($0.04) |
| 8/25 |
Toll Brothers 'TOL'
reports earnings. Time unknown. est.
$1.19 |
| 8/26 |
WPP Group 'WPPGY'
reports earnings. Time unknown. $1.38 |
|
Prime
Update:
Sterling Investment Services
is an investment research and money management
firm publishing the Prime
Stock Newsletter. The Prime
Stock Newsletter is a daily comprehensive
newsletter that is useful for investors
and traders alike. Whether you are looking
for short term trading opportunities ranging
from day trading to a couple of weeks
or if you looking to acquire a long term
portfolio at smart entry points. Subscriptions
are $50/month. A Free
2 Week Trial is currently being offered.
Highlights
from Recent editions of the Prime
Stock Newsletter |
| Recommendation |
Date |
Entry
Point |
Recent
Close or Exit Price |
Profit* |
Note |
| BCE, Inc. 'BCE' |
Aug 5 |
$25.00/share |
$25.95 intra day
high on Aug 11th. |
$0.95 |
|
| United
Health 'UNH' shorted |
Aug 8 |
$52.06 |
$51.02 intra day
low on Aug. 9th |
$12.7 |
|
| Massey
Energy 'MEE' |
Aug 10 |
$46.46 |
$49.45 intra-day
high on Aug 22nd |
$2.99 |
Should move higher. |
| * The
per share PROFIT is a theoretical
calculation based upon the opening
price the day the recommendation is
published and the intra day high (or
low for short sales) on the exit day.
The exit day is determined based upon
the application of our "Rules
for Trading", the implementation
of "stops" within our stated
policy, and may not reflect the complete
or full movement of the underlying
recommendation. |
|
Dow Jones Industrial
Average (INDU)
Current Opinion:
Closed @ 10,600.31 Last
Signal: Called Lower on August
5th with the previous day's close of
10,0610.10
Current Expectations: I am expecting
the Dow Jones Industrial Average to
pullback over the short term and move
lower and test 10,546.32 If the Dow
closes below this level then it should
continue to move lower and test 10,432.51
|
The
S&P 500
Current Opinion: Closed
@ 1,230.39 Last Signal: Called
Lower on August 5th with the previous
day's close of 1,235.86 Current Expectation:
I am expecting the S&P 500 to to pullback
over the short term and test 1,225.31
and then 1,2166.96 if the support at 1,225.31
fails to hold. |
The
NASDAQ 100 (NDX)
Current Opinion: Closed
@ 1,591.75 Last Signal:
Called Lower on August 5th with the previous
day's close of 1,608.74 Current Expectations:
I am expecting the NDX to pullback over
the short term and test 1,568.96 |
CBOE
Ten Year Treasury Index (TNX)
Current Opinion: Closed
@ 4.238% Last Signal:
Called Lower on August 15th with the previous
day's close of 4.238% Current
Expectations: The TNX should
move lower and test 4.196% and then 4.177%
on a closing basis. |
Disclaimer:
The Sterling Investments series of newsletters is produced by Sterling
Investment Services, Inc. All information
used in the production has been obtained
from sources believed to be reliable and
accurate. Sterling Investment Services
does not warrant or assume any liability
for inaccuracy of the information used
to produce our publications. To receive
further information on these services
please visit our web page at: www.sterlinginvestments.com
If you would like to contact us our fax
# is (404)-816-8830 Email address is:
enelson@sterlinginvestments.com Sterling
Investment Services may hold positions
in the securities recommended or may be
providing consulting services to the companies
mentioned within this report. |
Last
Week's Edition of the Sterling Weekly
|
|