I am in the process of preparing for hip replacement surgery, and as a result my work schedule has been somewhat erratic lately. Due to the fact that there is a good chance my publication schedule will most likely be somewhat erratic, I have decided to make the Prime Stock Newsletter free to the public until July 10th, 2009. I should be more than recovered from the surgery by then and we should be seeing any more interruptions in the publication schedule. If you would like to take advantage of the free subscription offer, please click (here).
Last week the overall market, as measured by the Dow Jones Industrial Average lost approximately 2.9%, or approximately 259 points to finish the week at 8,539.73. As I stated in the previous edition of the Sterling Weekly, the Dow Jones Industrial Averages 'INDU' has been essentially tracking sideways since early May, and it continues to look as if the sideways movement is going to continue for the time being. While it is unclear how much longer this sideways trend will continue, I suspect that the reason the market is trending sideways is because it is unclear how the changes to the economy are going to play out. However, once this becomes clearer, I expect regardless of the direction the market moves, the move will be a big one.
This week I would like to take a look at the price of gold, which closed at $979.28 per ounce on Friday. I have inserted 2 charts on the price of gold below. The 1st chart is a chart showing the weekly price of Gold from early 2006 through Monday May 25th, 2009, and the second chart shows the daily price of gold up through the trading activity of May 29th, 2009.
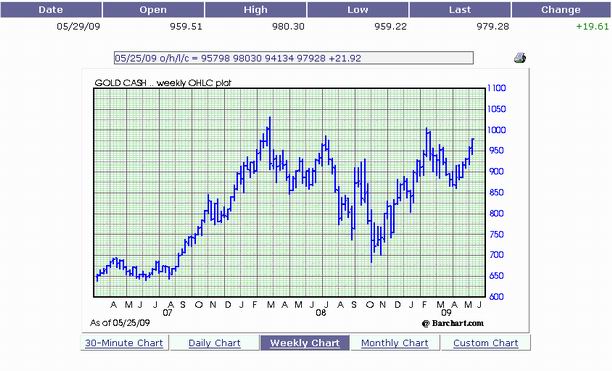
What this 1st chart is showing is that the price of gold reached an approximately closing high of $1,002.66 per ounce on May 10th, 2008; and that the price of Gold reached an approximate closing low of $722.30 per ounce on October 27th, 2008.
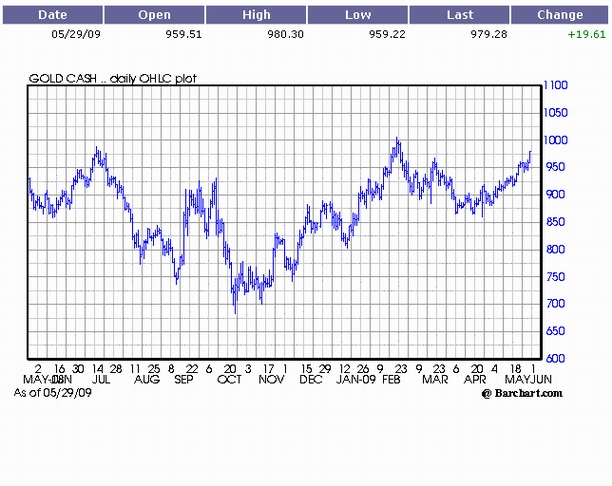 The second chart is showing us that the price of reached a closing high of $993.25 per ounce on February 20th of this year; and it subsequently reached a closing low of $869.12 per ounce on April 17th of this year. The price of gold is clearly in an upward trend. There is ia reasonable good chance that the price of gold is going to continue to move higher and test its yearly closing high of $993.25 per ounce. In looking at the price of gold on the weekly, and daily chart it looks like the price of gold is in the process of completing what technical analyst refer to as a "cup and handle pattern", which is a very bullish trading pattern. The longer term, and larger pattern is the "cup" portion of the pattern, which is being played out on the weekly chart; and the "handle" portion of the pattern is the shorter term and smaller pattern being played out on the daily chart. A close above $993.25 per ounce would complete the "handle" portion of the pattern and provide a measured move to $1,117.37 per ounce. A closing trade above $1,002.66 per ounce would complete the "cup" portion of the pattern and provide for a measured move to $1,283.02 per ounce. Based upon my experience as a technical analyst, it looks pretty clear that the price of Gold is headed towards $1,300 per ounce. The second chart is showing us that the price of reached a closing high of $993.25 per ounce on February 20th of this year; and it subsequently reached a closing low of $869.12 per ounce on April 17th of this year. The price of gold is clearly in an upward trend. There is ia reasonable good chance that the price of gold is going to continue to move higher and test its yearly closing high of $993.25 per ounce. In looking at the price of gold on the weekly, and daily chart it looks like the price of gold is in the process of completing what technical analyst refer to as a "cup and handle pattern", which is a very bullish trading pattern. The longer term, and larger pattern is the "cup" portion of the pattern, which is being played out on the weekly chart; and the "handle" portion of the pattern is the shorter term and smaller pattern being played out on the daily chart. A close above $993.25 per ounce would complete the "handle" portion of the pattern and provide a measured move to $1,117.37 per ounce. A closing trade above $1,002.66 per ounce would complete the "cup" portion of the pattern and provide for a measured move to $1,283.02 per ounce. Based upon my experience as a technical analyst, it looks pretty clear that the price of Gold is headed towards $1,300 per ounce.
Oh, and by the way, on December 31st, 2005 the price of gold closed at $517.03 per ounce. On January 5th, 2006 I published a report titled "A comprehensive Technical Analysis of the Philadelphia Gold & Silver Index 'XAU'." In the report I stated that I believed "that the price of gold will move above $600 per ounce in the short to intermediate term,and I believe there is a very good chance it could get close to $1,000/ounce over the longer term, perhaps in as little as 2-3 years." Approximately 4 months after publishing the report the price of gold reached the $600 per ounce mark, and in just under 2 1/2 years the price of gold reached the $1,000 per ounce price level. A copy of that report is available for your review (here).
Next week, I will take a look at the Philadelphia Gold & Silver Index 'XAU'.
|