Sterling Investment Services for all your stock and options trading needs. Stock Tips

Stock and Option Trading Ideas
 
Loading

Market Data and Free Tools

Markets Overview
Market Momentum
Nada
Commodities
52 Week Highs
52 Week Lows
Volume Leaders
Price Advances
Price Declines
Percent Advances
Percent Declines

Symbol Lookup
Custom Quotes
Custom Portfolio


Free Newsletter

Join our mailing list
and receive our FREE Weekly Newsletter!

subscribe unsubscribe

Interested in reselling the Sterling Investment Services Prime Stock Newsletter or referring subscribers and earning extra income?? (more)

New Features - Coming Soon

Daily Market Commentary Daily Long or Short Stock Recommendation and our option recommendation. Select Fundamental Info. Our Technical Analysis of the Stock!

If you think traders & investors find this information useful then you should be one of our affiliates!


Announcements

Sterling Small Cap Letter.

Sterling Investment Services is now publishing our Small Cap Review newsletter that highlights small and micro cap companies that we should be of interest to our readers. Additional information on the Small Cap. Review can be found (here).


Sterling Custom Research

Sterling Investment Services has recently published a small cap. research report on Sun River Energy, Inc. (SNRV.OB). This is a company that we think has some pretty interesting potential. A copy of our report can be found (here).


www.sterlinginvestments.com


Sterling Weekly for March 16th, 2009

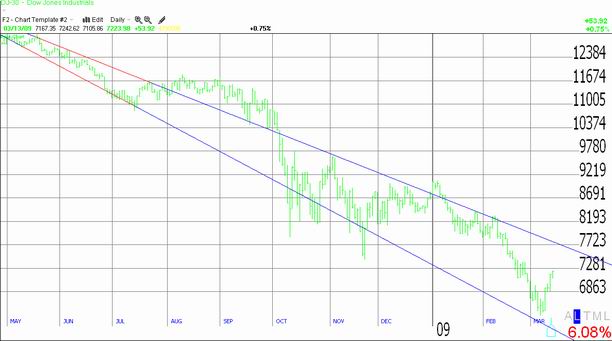
The overall market as measured by the Dow Jones Industrial Average gained 597.04 points or approximately 9.0% last week to finish at 7,223.98. The major items that appear to have sparked the rally was the announcement that the major banks had been profitable during the 1st quarter of 2009, and the House subcommittee holding hearings on "mark to market" accounting instructed FASB to come up with an alternative to mark to market accounting. It looks like the Dow Jones Industrial Average will continue to move higher. It should test the upside resistance at 7,552.23 and if it closes above that level, it will probably continue to move higher and test the upper of the 2 downward trendlines that have been influencing the market for the last 4 months. I am currently estimating that to be approximately 7,775 Also, it looks like that trendline is deckling at approximately 18 points per day. However I doubt the Dow Jones Industrial Average will move much higher above those levels. The chart below shows the Dow Jones Industrial Average and the trendlines mentioned above.

Dow Jones Industrial Average as of March 13th, 2009

On this week's economic calendar we have the Producer Price Index 'PPI', the government's measure of inflation at the wholesale level; and the Consumer Price Index 'CPI', the government's measure of the inflation at the consumer level. These reports are important because they strongly influence monetary policy, or at least they are supposed to if our President of the Federal Reserve is doing his job.

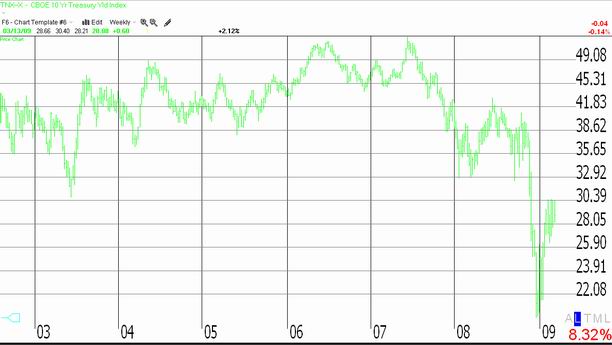
In order to maintain solid economic growth, a country needs to have a stable monetary policy that produces a stable currency and a low inflationary environment. The Fed Funds Rate is the primary tool through which the Federal Reserve Board influences monetary policy. As I wrote in the August 15th, 2005 edition of the Sterling Weekly "historically the Fed Funds Rate has been approximately 1.25% above the rate of inflation,..." This is the level of Fed Funds that historically keeps inflation under control and produces a stable (non-declining) currency that is vital to international trade. Well, the year over year change in the core rate of the CPI is approximately 1.7%, this implies that the Fed Funds should be at approximately 3.0%, substantially higher than where it is now. This is also significant, because all the other long term rates are based off of the Fed Funds rate. With the current yield on the 10-year government bond currently at 2.888%, I think that yield on the 10 year bond should be in the 4.0% to 4.5% range to be in line with its historical levels, as the chart below shows.

10 Year Government Bond Yield

The reason I am discussing this is that we are now in the process of producing the largest federal deficits as a percentage of GDP since World War II, and all the money the Federal government is pumping into the economy is going to have an inflationary effect, sooner or later it will cause inflation to increase and pick up. As we learned from the Carter years, rising inflation will require substantially higher interest rates to combat the damaging effects of high inflation. So here is what I am looking at, the huge budget deficits and the efforts to keep mortgage rates artificially low will probably produce and inflation rate of somewhere in the range of 6-8%. This will require Fed Funds to be somewhere in the neighborhood of 7.25% to 9.25%

During the middle part of this decade when investors felt the Federal government had inflation under control, they were basing housing mortgage loan rates off the 10 year government bond. Well, if we see the Fed Funds rate at 7.25% to 9.25%, it would be reasonable to expect that the 10 year bond yield would be somewhere in the range of 10-15%. If mortgage loan rates continue to track the 10 year bond yield, then the affordability of the US housing market is going to decline very dramatically. Under this scenario, and I expect that I am not too far off base, I would be avoiding longer term government bonds and companies tied too closely to the US housing industry. And by the way, all those housing programs announced by the Obama administration that are designed to prevent foreclosures, I don't see them working under any scenario and I am pretty sure they will simply delay the recovery in housing and further cause our deficit to grow out of control.


Sterling Calendars for the Week of March 9th, 2009
Economic Calendar
Date Est. Time Release

For

Consensus Prior
03/16 8:30am Empire Manufacturing Mar. (32.0) (34.65)
03/16 9:00am Net Long Term TIC Flows Jan.   $34.8b
03/16 9:15am Industrial Production Feb. (1.2%) (1.8%)
03/16 9:15am Capacity Utilization Feb. 71.1% 72.0%
03/17 8:30am Building Permits Feb. 510k 531k
03/17 8:30am Core PPI Feb. 0.1% 0.4%
03/17 8:30am Housing Starts Feb. 453k 466k
03/17 8:30am PPI Feb. 0.4% 0.8%
03/18 8:30am Core CPI Feb. 0.1% 0.2%
03/18 8:30am CPI Feb. 0.3% 0.3%
03/18 8:30am Current Account Balance Q4 ($136.7B)  
03/18 10:30am Crude Inventories 03/13   749K
03/18 2:15pm FOMC Rate Decision     0.0-0.25%
03/19 8:30am Initial Claims 03/14   654k
03/19 10:00am Leading Indicators Feb. (0.6%) 0.4%
03/19 10:00am Philadelphia Fed. Mar. (40.0) (41.3)

  Misc. Calendar
Date: Comments:
03/16 Fortress Investment Group 'FIG' announces earnings before the open. Est. ($0.01)
03/16 U.S. Hones 'USHS' announces earnings after the close. Est. $0.09
03/17 Adobe Systems 'ADBE' announces earnings. Time N/A. Est. $0.44
03/18 Darden Restaurants 'DRI' announces earnings. Time N/A. Est. $0.68
03/18 General Mills 'GIS' announces earnings before the open. Est. $0.88
03/18 Nike 'NKE' announces earnings at 4:15pm ET. Est. $0.80
03/19 3Com Corp. announces earnings after the close. Est. $0.10
03/19 Blockbuster 'BBI' announces earnings after the close. Est. $0.25
03/19 Discover Financial Svs. 'DFS' announces earnings before the open. Est. ($0.15)
03/19 Fedex 'FDX' announces earnings. TIme N/A. Est. $0.46
03/19 Palm, Inc. 'PALM' announces earnings. Time N/A. Est. ($0.60)
03/19 Winnebago 'WGO' announces earnings at 7:00am ET. Est. ($0.30)
03/20 Kirkland's Inc. 'KIRK' announces earnings before the open. Est. $0.52
  The full earnings calendar for this week can be found (here)

Prime Update:

Sterling Investment Services is an investment research and money management firm publishing the Prime Stock Newsletter. The Prime Stock Newsletter is a daily comprehensive newsletter that is useful for investors and traders alike. Whether you are looking for short term trading opportunities ranging from day trading to a couple of weeks or if you looking to acquire a long term portfolio at smart entry points. Subscriptions are $50/month. A Free 2 Week Trial is currently being offered.

Our most recent Performance Report is now available available (here). 11 of our last 20 recommendation resulted in profitable trades for an average profit of $0.97/share. This is an 55% success rate.

Highlights from Recent editions of the Prime Stock Newsletter
Recommendation Date Entry Point Recent Close or Exit Price Profit* Note
Raytheon 'RTN' Short sale Feb 26 $43.37 $35.96 $7.41 Covered on March 4th
Visa, Inc. 'V' Short Sale Mar 4 $54.01 $49.21 $4.65 Covered on March 6th
Suncor Energy 'SU' Mar 10 $23.80 $26.18 $2.38 Closed on the 13th.
           
* The per share PROFIT is a theoretical calculation based upon the opening price the day the recommendation is published and the intra day high (or low for short sales) on the exit day. The exit day is determined based upon the application of our "Rules for Trading", the implementation of "stops" within our stated policy, and may not reflect the complete or full movement of the underlying recommendation.

Dow Jones Industrial Average (INDU)

Current Opinion: Closed @ 7,223.98 Last Signal: Called higher with the close of 6,930.40 on March 11th, 2009. Current Expectations: I expect the Dow Jones Industrial Average to continue to move higher and test 7,552.29 and then 8,175.77 on a closing basis.


The S&P 500

Current Opinion: Closed @ 756.55 Last Signal: Called higher with the close of 721.36 on March 11th, 2009. Current Expectations: I expecting the S&P 500 to continue to move higher and 805.22 on a closing basis.


The NASDAQ 100 (NDX)

Current Opinion: Closed @ 1,168.52 Last Signal: Called higher with the close of 1,125.95 on March 11th, 2009 Current Expectations: The NDX should continue to move higher and test 1,236.85 and then 1,281.65 on a closing basis.


CBOE Ten Year Treasury Index (TNX)

Current Opinion: Closed @ 2.888% Current Expectations: The TNX should move higher and test 3.340% on a closing basis. Please note that the longer term trading range of this index indicates that the current yield on the 10 year bond is abnormally low and it would be prudent to expect that the yield on the 10 year bonds should return to more normalized levels of 4.5% plus.


Disclaimer: The Sterling Investments series of newsletters is produced by Sterling Investment Services, Inc. All information used in the production has been obtained from sources believed to be reliable and accurate. Sterling Investment Services does not warrant or assume any liability for inaccuracy of the information used to produce our publications. To receive further information on these services please visit our web page at: www.sterlinginvestments.com If you would like to contact us our fax # is (404)-816-8830 Email address is: enelson@sterlinginvestments.com Sterling Investment Services may hold positions in the securities recommended or may be providing consulting services to the companies mentioned within this report.
©1999 - 2008 Copyrighted, All Rights Reserved