Sterling Investment Services for all your stock and options trading needs. Stock Tips

Stock and Option Trading Ideas
 
Loading

Market Data and Free Tools

Markets Overview
Market Momentum
Nada
Commodities
52 Week Highs
52 Week Lows
Volume Leaders
Price Advances
Price Declines
Percent Advances
Percent Declines

Symbol Lookup
Custom Quotes
Custom Portfolio


Free Newsletter

Join our mailing list
and receive our FREE Weekly Newsletter!

subscribe unsubscribe

Interested in reselling the Sterling Investment Services Prime Stock Newsletter or referring subscribers and earning extra income?? (more)

New Features - Coming Soon

Daily Market Commentary Daily Long or Short Stock Recommendation and our option recommendation. Select Fundamental Info. Our Technical Analysis of the Stock!

If you think traders & investors find this information useful then you should be one of our affiliates!


Announcements

Sterling Small Cap Letter.

Sterling Investment Services is now publishing our Small Cap Review newsletter that highlights small and micro cap companies that we should be of interest to our readers. Additional information on the Small Cap. Review can be found (here).


www.sterlinginvestments.com


Sterling Weekly for the Week of March 1st, 2010
A Look at the S&P Retail Index 'RLX'

Since the previous edition of the Sterling Weekly, the Dow Jones Industrial Average lost 77.09 points or approximately 0.7%, to finish at 10,325.26. Unfortunately while the overall market appears to be tracking sideways with a downward bias, the intra-day volatility continues to be rather severe with the Dow Jones Industrial Average making intra-day swings of a couple hundred points during the day only to finish the day slightly changed. This to me indicates a great deal of uncertainty about the mid to long term direction of the market.

In this week's edition of the Sterling Weekly I wanted to take a look at the S&P Retail Index 'RLX' which set a new yearly closing high on Friday. This makes the S&P Retail Index 'RLX' one of the better performing indices over the course of the last 12 months. The 'RLX' is designed to track the performance of the US retail industry. I've inserted a recent chart on the 'RLX' below for your review.

S&P Retail Index 'RLX'

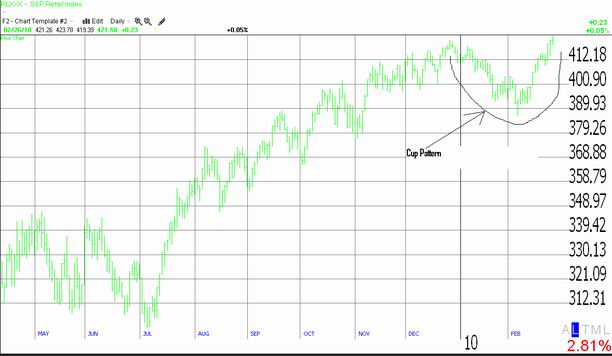
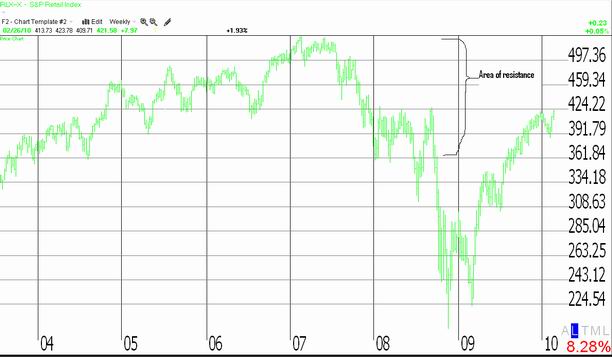
As you can see from the chart, the 'RLX', which closed Friday @ 421.58, has completed a small "cup pattern" with a measured move to approximately 445.53 on a closing basis. While this is positive over the short term, I would like to offer a point of caution on a longer term basis. As the longer term chart on the 'RLX' below shows, the 'RLX' has now re-entered an area of upside resistance that has held it somewhat range bound for a period of approximately four (4) years of trading prior to last year's pullback. In other words I would not be expecting a move to the 497 or higher level any time soon. Additional information on the 'RLX' can be found (here.)

S&P Retail Index 'RLX' longer term

I would like to point out that this week has a very heavy economic's calendar with the big news being at the end of the week with the unemployment report. However I would not ignore the personal income and spending reports at the start of the week either.


Sterling Calendars for the Week of March 1st, 2010.
Economic Calendar

Date

Est. Time Release

For

Consensus Prior
03/01 8:30am Personal Income Jan. 0.4% 0.4%
03/01 8:30am Personal Spending Jan. 0.4% 0.2%
03/01 8:30am PCE Prices - Core Jan. 0.1% 0.1%
03/01 10:00am Construction Spending Jan. (0.5%) (1.2%)
03/01 10:00am ISM Index Feb. 57.8 58.4
03/02 2:00pm Auto Sales Feb. N/A. 3.8M
03/02 2:00pm Truck Sales Feb. N/A 4.4M
03/03 7:30am Challenger Job Cuts YOY Feb. N/A (70.4%)
03/03 8:15am ADP Employment Change Feb. (10K) (22K)
03/03 10:00am ISM Services Feb. 51.0 50.5
03/03 10:30am Crude Inventories 02/26 N/A 3.03M
03/03 2:00pm Fed's Beige Book Mar.    
03/04 8:30am Initial Claims 02/27 475K 495K
03/04 8:30am Continuing Claims 02/20 N/A 4,617K
03/04 8:30am Productivity - Rev. Q4 6.2% 6.2%
03/04 8:30am Unit Labor Costs Q4 (4.4%) (4.4%)
03/04 10:00am Factory Orders Jan. 1.2% 1.0%
03/04 10:00am Pending Home Sales Jan. 1.7% 1.0%
03/05 8:30am Unemployment Rate Feb. 9.8% 9.7%
03/05 8:30am Nonfarm Payrolls Feb. (20K) (20K)
03/05 8:30am Hourly Earnings Feb. 0.2% 0.2%
03/05 8:30am Average Workweek Feb. 33.7 33.9
03/05 3:00pm Consumer Credit Jan. ($3.8B) ($1.7B)
  Misc. Calendar
Date: Comments:
03/01 Ann Taylor Stores 'ANN' announces earnings. Est. ($0.02) Time N/A.
03/01 Big Lots 'BIG' announces earnings. Est. $1.28 Time N/A
03/02 Cooper Tire & Rubber 'CBT' announces earnings before the open. Est. $0.47
03/02 Staples 'SPLS' announces earnings. Time N/A. Est. $0.39
03/03 BJ's Wholesale Club 'BJ' announces earnings. Time N/A. Est. $0.96
03/03 Dillards 'DDS' announces earnings. Time N/A. $0.92
03/04 Costco 'COST' announces earnings. Time N/A. Est. $0.71
03/04 Western Refining 'WNR' announces earnings before the open. Est. ($0.68)
03/05 Urban Outfitters 'URBN' announces earnings. Time N/A. Est. $0.40
  The full earnings calendar for this week can be found (here)

Prime Update:

The Prime Stock Newsletter is our daily newsletter that contains commentary on the overall market, and our single best trading idea for the day! (Both Long & Short Sale Recommendations) We select this stock through a combination of technical (charting) and fundamental (financial) analysis. The Prime Stock Newsletter provides select expanded quotation information, corporate description, select recent company news, our technical analysis of the shares and our expectations, and our options recommendation for the company.

Our most recent Performance Report is now available available (here). We are proud to report 17 of our last 20 recommendation resulted in profitable trades for an average profit of $0.39/share. This is an 85% success rate.

Archived copies of our Performance Reports can be found (here).

Highlights from Recent (20) Editions of the Prime Stock Newsletter
Recommendation Date Entry Point Recent Close or Exit Price Profit* Note
Suncor Energy 'SU' Feb 03 $31.24 $30.25 $0.99 Covered on the 3rd
Seagate Tech. 'STX' Feb 17 $19.94 $20.94 $1.00 Sold on the 18th.


* The per share PROFIT is a theoretical calculation based upon the opening price the day the recommendation is published and the intra day high (or low for short sales) on the exit day. The exit day is determined based upon the application of our "Rules for Trading", the implementation of "stops" within our stated policy, and may not reflect the complete or full movement of the underlying recommendation.


Disclaimer: The Sterling Investments series of newsletters is produced by Sterling Investment Services, Inc. All information used in the production has been obtained from sources believed to be reliable and accurate. Sterling Investment Services does not warrant or assume any liability for inaccuracy of the information used to produce our publications. To receive further information on these services please visit our web page at: www.sterlinginvestments.com If you would like to contact us our fax # is (404)-816-8830 Email address is: enelson@sterlinginvestments.com Sterling Investment Services may hold positions in the securities recommended or may be providing consulting services to the companies mentioned within this report.
©1999 - 2010 Copyrighted, All Rights Reserved