Sterling Investment Services for all your stock and options trading needs. Stock Tips

Stock and Option Trading Ideas
 
Loading

Market Data and Free Tools

Markets Overview
Market Momentum
Nada
Commodities
52 Week Highs
52 Week Lows
Volume Leaders
Price Advances
Price Declines
Percent Advances
Percent Declines

Symbol Lookup
Custom Quotes
Custom Portfolio


Free Newsletter

Join our mailing list
and receive our FREE Weekly Newsletter!

subscribe unsubscribe

Interested in reselling the Sterling Investment Services Prime Stock Newsletter or referring subscribers and earning extra income?? (more)

New Features - Coming Soon

Daily Market Commentary Daily Long or Short Stock Recommendation and our option recommendation. Select Fundamental Info. Our Technical Analysis of the Stock!

If you think traders & investors find this information useful then you should be one of our affiliates!


Announcements

Sterling Small Cap Letter.

Sterling Investment Services is now publishing our Small Cap Review newsletter that highlights small and micro cap companies that we should be of interest to our readers. Additional information on the Small Cap. Review can be found (here).


Sterling Custom Research

Sterling Investment Services has recently published a small cap. research report on Sun River Energy, Inc. (SNRV.OB). This is a company that we think has some pretty interesting potential. A copy of our report can be found (here).


www.sterlinginvestments.com


Sterling Weekly for the Week of December 7th, 2009
Where Do We Go From Here?

Since the previous edition of the Sterling Weekly, the Dow Jones Industrial Average rose 78.98 points to finish the week at 10,388.90 I was out of the office and traveling for 3 days last week at a convention in Las Vegas. I always find travel interesting because it give you chance to see what other people are talking about in different parts of the country. While I was in Las Vegas, the buzz focused on the drop off in the convention and casino business this year. Almost universally the locals I spoke to blamed President Obama and the other Democrat's in congress for making the decline worse than it needed to be by demonizing Las Vegas as a place to hold business meetings. The other interesting things the "locals" were talking about was the unionization of the casinos and how it was bad for both the customers of these casinos and the casinos themselves. While I was flying back to Atlanta I sat next to a very nice elderly couple. One of the things they talked about was that they had been holders of General Motors bonds prior to the bankruptcy filing. They rightly believed as senior creditors they should have been second (2nd) in line in any bankruptcy reorganization instead of being wiped out as they were. They were more than a little miffed at the Obama administration for giving such a large percentage of the company to the Unions who should have received nothing under normal bankruptcy proceedings. Well, I've often said there is nothing more determined than an organized victims group; and it looks like I meet two (2) of them on this trip, and they tend to have long memories. If that is the case, then it looks we are going to be in for some changes in not just 2010, but 2012 as well.

One of the more common questions that I hear is "where do we go from here?" It is usually asked following comment about how well the market has done since it rebounded from its lows earlier this year. It might be more important to ask ourselves how much more upside should we expect? One of the major factors in determining where the market goes from here, and how much more upside we should expect is the American consumer. The American consumer is a major force in the American economy, and how the consumer fairs will also be a major determining factor in how the overall economy does. The Morgan Stanley Consumer Index 'CMR' is an index designed to track the shares of companies that focus on the American consumer. I have inserted a 3-day chart of the 'CMR' below. We can that the index has rallied nicely from its March lows and has now reached levels where the index traded for almost all of 2008.

CMR 3 Day Chart

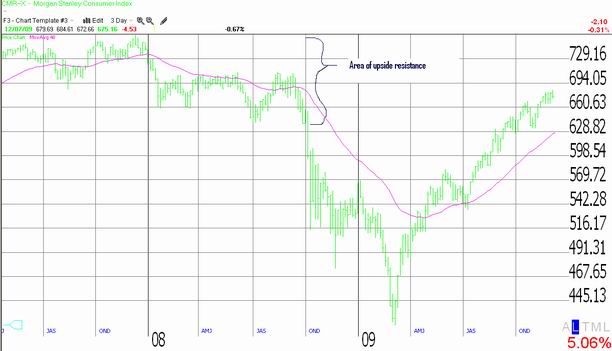
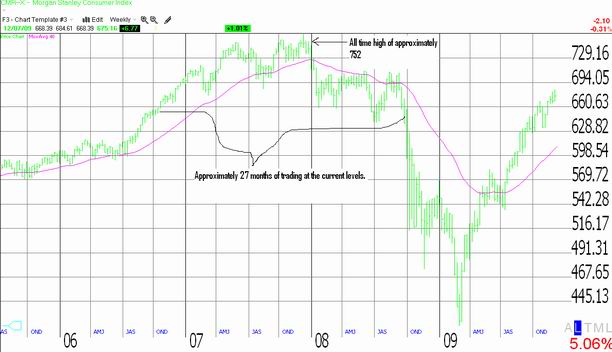
Below I have inserted a weekly chart of the 'CMR.' In looking at this longer term chart of the 'CMR' we can see that when the economy was performing at its peak, the all time high on the 'CMR' was approximately 752. The 'CMR' closed at 675 on December 7th of this year, needing to rise approximately another 11% to reach the 752 level. While that may not sound like much given recent market history, let stop and ask ourselves a couple of key questions. 1. How is consumer spending going to reach the 2007 levels with unemployment having risen from approximately 4% to 10%?? 2. How is consumer spending going to reach the 2007 levels with the banks having tightened credit so dramatically?? I don't think consumer spending can return to those levels given the current state of the economy. Additionally take a look at the chart below, the 'CMR' spent approximately 27 months trading where I have identified upside resistance. In my opinion, the market is going to need a long time for the 'CMR' to chew through all that overhead resistance; probably anywhere from 18 to 36 months.

CMR 5 Day Chart

So where do we go from here?? How much more upside do we have left?? Well, I think our future upside is rather limited for the time being. I think at best the overall market is going to track sideways for quite a while, if we are lucky. The real risk I see is that consumer spending does not return and the market then moves back lower. If that happens, then economic recovery will depend upon businesses to generate the growth that eventually brings the consumer back.


Sterling Calendars for the Week of December 7th, 2009
Economic Calendar
Date Est. Time Release

For

Consensus Prior
12/07 2:00pm Consumer Credit Oct. ($9.3B) ($14.8B)
12/09 10:00am Wholesale Inventories Oct. (0.5%) (0.9%)
12/09 10:30am Crude Inventories 12/04   2.09M
12/10 8:30am Initial Claims 12/05 465K 457K
12/10 8:30am Continuing Claims 12/04 5,435K 5,465K
12/10 8:30am Trade Balance Oct. ($37.0B) ($36.5B)
12/10 2:00pm Treasury Budget Nov. ($134.1B) ($176.4B)
12/11 8:30am Export Prices Ex-Ag. Nov. N/A 0.3%
12/11 8:30am Import Prices Ex-Oil Nov. N/A 0.4%
12/11 8:30am Retail Sales Nov. 0.7% 1.4%
12/11 8:30am Retail Sales Ex-Auto Nov. 0.4% 0.2%
12/11 9:55am Michigan Sentiment Dec. 68.5 67.4
12/11 10:00am Business Inventories Oct. (0.3%) (0.4%)

Prime Update:

The Prime Stock Newsletter is our daily newsletter that contains commentary on the overall market, and our single best trading idea for the day! (Both Long & Short Sale Recommendations) We select this stock through a combination of technical (charting) and fundamental (financial) analysis. The Prime Stock Newsletter provides select expanded quotation information, corporate description, select recent company news, our technical analysis of the shares and our expectations, and our options recommendation for the company.

Our most recent Performance Report is now available available (here). We are proud to report 18 of our last 20 recommendation resulted in profitable trades for an average profit of $0.80/share. This is an 90% success rate.

Archived copies of our Performance Reports can be found (here).

Highlights from Recent (20) Editions of the Prime Stock Newsletter
Recommendation Date Entry Point Recent Close or Exit Price Profit* Note
Newmont Mining 'NEM' Nov 9 $50.07 $51.30 $1.23 Sold on the 9th
Ingersoll-Rand 'IR' Nov 13 $36.03 $37.60 $1.57 Sold on the 16th
Rockwell Auto 'ROK' Nov 17 $45.18 $46.72 $1.54 Sold on the 18th
* Our September 29th recommendation of Direct TV 'DTV' @ $27.28/share, set a new yearly closing high of $31.54/share on Friday.
* The per share PROFIT is a theoretical calculation based upon the opening price the day the recommendation is published and the intra day high (or low for short sales) on the exit day. The exit day is determined based upon the application of our "Rules for Trading", the implementation of "stops" within our stated policy, and may not reflect the complete or full movement of the underlying recommendation.


Disclaimer: The Sterling Investments series of newsletters is produced by Sterling Investment Services, Inc. All information used in the production has been obtained from sources believed to be reliable and accurate. Sterling Investment Services does not warrant or assume any liability for inaccuracy of the information used to produce our publications. To receive further information on these services please visit our web page at: www.sterlinginvestments.com If you would like to contact us our fax # is (404)-816-8830 Email address is: enelson@sterlinginvestments.com Sterling Investment Services may hold positions in the securities recommended or may be providing consulting services to the companies mentioned within this report.
©1999 - 2009 Copyrighted, All Rights Reserved