Sterling Investment Services for all your stock and options trading needs. Stock Tips

Stock and Option Trading Ideas
 
Loading

Market Data and Free Tools

Markets Overview
Market Momentum
Nada
Commodities
52 Week Highs
52 Week Lows
Volume Leaders
Price Advances
Price Declines
Percent Advances
Percent Declines

Symbol Lookup
Custom Quotes
Custom Portfolio


Free Newsletter

Join our mailing list
and receive our FREE Weekly Newsletter!

subscribe unsubscribe

Interested in reselling the Sterling Investment Services Prime Stock Newsletter or referring subscribers and earning extra income?? (more)

New Features - Coming Soon

Daily Market Commentary Daily Long or Short Stock Recommendation and our option recommendation. Select Fundamental Info. Our Technical Analysis of the Stock!

If you think traders & investors find this information useful then you should be one of our affiliates!


Announcements

Sterling Small Cap Letter.

Sterling Investment Services is now publishing our Small Cap Review newsletter that highlights small and micro cap companies that we should be of interest to our readers. Additional information on the Small Cap. Review can be found (here).


Sterling Custom Research

Sterling Investment Services has recently published a small cap. research report on Sun River Energy, Inc. (SNRV.OB). This is a company that we think has some pretty interesting potential. A copy of our report can be found (here).


www.sterlinginvestments.com


Sterling Weekly for the Week of November 30th, 2009
Thoughts on a Declining US Dollar.

Since the previous edition of the Sterling Weekly, the Dow Jones Industrial Average declined 8.94 points to finish the week at 10,309.92 I was out of the office and traveling for 2 days last week on a consulting project. While I was away from the office I had several meetings with individuals from the United States, Canada, and Latin America. A continuing theme to our conversations, and somewhat to the general tone of discussion this entire year, is what to do with the current market??

What made last week's conversations somewhat different is that they included non US citizens with a more international outlook than your typical American. Unfortunately the underlying theme is the same, no one has any confidence in the current administration and congress's ability to provide for an economic climate that allows businesses to grow and thrive; and everyone is concerned that the deficit and debt levels are going to destroy the US Dollar and the US economy along with it.

US Dollar Index - 1 Year

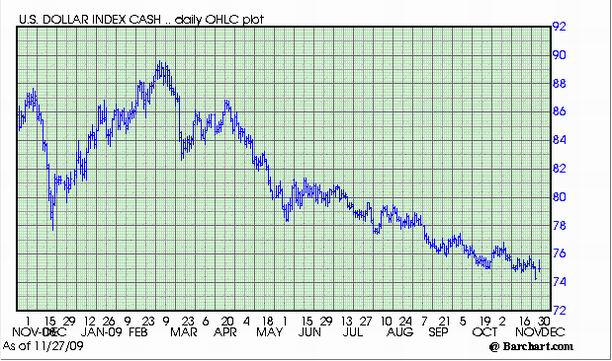
The chart above shows the decline in the US Dollar as compared to the other major currencies. Most of the financial press is talking about the decline in the Dollar, and as a result, almost everyone I know is talking about moving their spare cash out of US Dollars and into another currency. The problem is that most people don't really have any idea which foreign currency they should be buying, or how much lower the Dollar can really go. In order to help answer that question I have inserted below a 25 year chart on the US Dollar Index.

US Dollar Index 25 year Chart

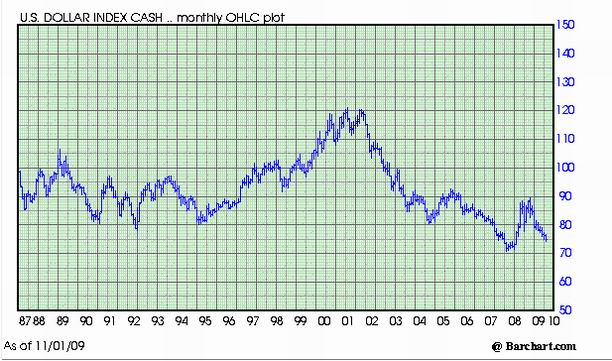
I am not an expert in foreign currency transactions, but I would like to think I am pretty good at reading a chart. Unfortunately my read of the chart above leads me to believe that if we see the US Dollar Index close below 70, then we could easily see a move to 50 on the US Dollar Index. While that may be good for the export sector of our economy, I don't see how it is good for any other sector. In the next few weeks I see if I can start answering that question on how to take advantage of the weakening US Dollar.


Sterling Calendars for the Week of November 30th, 2009
Economic Calendar
Date Est. Time Release

For

Consensus Prior
11/30 9:45am Chicago PMI Nov. 53.0 54.2
12/01 10:00am Construction Spending Oct. (0.4%) 0.8%
12/01 10:00am ISM Index Nov. 54.8 55.7
12/01 10:00am Pending Home Sales Oct. (0.5%) 6.1%
12/01 2:00pm Auto Sales Nov.    
12/01 2:00pm Truck Sales Nov.    
12/02 7:30an Challenger Job Cuts Nov.   (50.7%)
12/02 8:15am ADP Employment Report Nov. (148k) (203k)
12/02 10:30am Crude Inventories 11/27   1.02M
12/02 2:00pm Fed Beige Book Nov.    
12/03 8:30am Initial Claims 11/28 483K 466K
12/03 8:30am Continuing Claims 12/21 5,571k 5,423k
12/03 8:30am Productivity - Rev. Q3 8.5% 9.5%
12/03 8:30am Employment Cost Index Q3 N/A 0.4%
12/03 10:00am ISM Services Nov. 51.5 50.6
12/04 8:30am Nonfarm Payrolls Nov. (114k) (190k)
12/04 8:30am Unemployment Rate Nov. 10.2% 10.3%
12/04 8:30am Average Workweek Nov. 33.1 33.0
12/04 8:30am Hourly Earnings Nov. 0.2% 0.3%
12/04 10:00am Factory Orders Oct. 0.1% 0.9%

Prime Update:

The Prime Stock Newsletter is our daily newsletter that contains commentary on the overall market, and our single best trading idea for the day! (Both Long & Short Sale Recommendations) We select this stock through a combination of technical (charting) and fundamental (financial) analysis. The Prime Stock Newsletter provides select expanded quotation information, corporate description, select recent company news, our technical analysis of the shares and our expectations, and our options recommendation for the company.

Our most recent Performance Report is now available available (here). We are proud to report 19 of our last 20 recommendation resulted in profitable trades for an average profit of $0.85/share. This is an 95% success rate.

Highlights from Recent (20) Editions of the Prime Stock Newsletter
Recommendation Date Entry Point Recent Close or Exit Price Profit* Note
Newmont Mining 'NEM' Nov 9 $50.07 $51.30 $1.23 Sold on the 9th
Ingersoll-Rand 'IR' Nov 13 $36.03 $37.60 $1.57 Sold on the 16th
Rockwell Auto 'ROK' Nov 17 $45.18 $46.72 $1.54 Sold on the 18th
* Our September 29th recommendation of Direct TV 'DTV' @ $27.28/share, set a new yearly closing high of $31.54/share on Friday.
* The per share PROFIT is a theoretical calculation based upon the opening price the day the recommendation is published and the intra day high (or low for short sales) on the exit day. The exit day is determined based upon the application of our "Rules for Trading", the implementation of "stops" within our stated policy, and may not reflect the complete or full movement of the underlying recommendation.


Disclaimer: The Sterling Investments series of newsletters is produced by Sterling Investment Services, Inc. All information used in the production has been obtained from sources believed to be reliable and accurate. Sterling Investment Services does not warrant or assume any liability for inaccuracy of the information used to produce our publications. To receive further information on these services please visit our web page at: www.sterlinginvestments.com If you would like to contact us our fax # is (404)-816-8830 Email address is: enelson@sterlinginvestments.com Sterling Investment Services may hold positions in the securities recommended or may be providing consulting services to the companies mentioned within this report.
©1999 - 2009 Copyrighted, All Rights Reserved