Sterling Investment Services for all your stock and options trading needs. Stock Tips

Stock and Option Trading Ideas
 
Loading

Market Data and Free Tools

Markets Overview
Market Momentum
Nada
Commodities
52 Week Highs
52 Week Lows
Volume Leaders
Price Advances
Price Declines
Percent Advances
Percent Declines

Symbol Lookup
Custom Quotes
Custom Portfolio


Free Newsletter

Join our mailing list
and receive our FREE Weekly Newsletter!

subscribe unsubscribe

Interested in reselling the Sterling Investment Services Prime Stock Newsletter or referring subscribers and earning extra income?? (more)

New Features - Coming Soon

Daily Market Commentary Daily Long or Short Stock Recommendation and our option recommendation. Select Fundamental Info. Our Technical Analysis of the Stock!

If you think traders & investors find this information useful then you should be one of our affiliates!


Announcements

Sterling Small Cap Letter.

Sterling Investment Services is now publishing our Small Cap Review newsletter that highlights small and micro cap companies that we should be of interest to our readers. Additional information on the Small Cap. Review can be found (here).


Sterling Custom Research

Sterling Investment Services has recently published a small cap. research report on Sun River Energy, Inc. (SNRV.OB). This is a company that we think has some pretty interesting potential. A copy of our report can be found (here).


www.sterlinginvestments.com


Sterling Weekly for September 14th, 2009

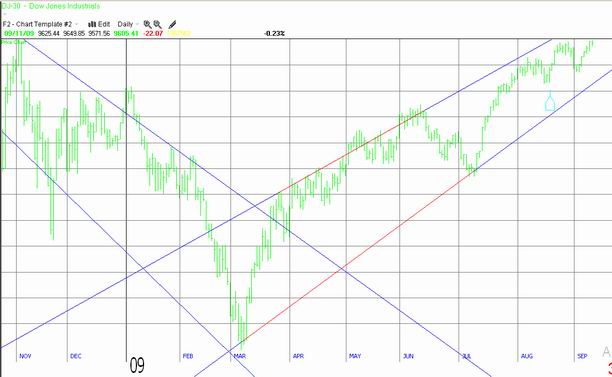
The overall market as measured by the Dow Jones Industrial Average rose 61.21 points, or approximately 0.006%, to finish @ 9,605.41 since the previous edition of the Sterling Weekly. In the August 31st edition of the Sterling Weekly I discussed a pair of trendlines that I thought were influencing the market and might lead to influence the market. Which I feel they did, as the market pulled back sharply and then slowly rallied to remain within the trendlines.

Time will tell if these trendlines are relevant. However, if they are, then I would not be surprised to the market continues to move higher through the end of this week, and then turn lower following the Labor Day Holiday Also, please note that this week's economic calendar has some rather weighty news towards the end of the week with jobless claims on Thursday and the unemployment rate on Friday. Either one of those announcements could move the market sharply, or not at all. I've inserted an updated version of the chart of the Dow Jones Industrial Average for your review. While I've always considered drawing trendlines to be more of an "art" than a "science," you can see there is some validity to the trendlines I've drawn.

Dow Jones Industrial Average 09-11-09

In the June 22nd edition of the Sterling Weekly I discussed the price of Gold, which then had closed at $979.28 per ounce, and that I felt was on an upward trend. I also stated that I felt that "A close above $993.25 per ounce would complete ... the pattern and provide a measure to $1,117.37 per ounce." I also stated "A closing trade above $1,002.66 per ounce would ... provide for a measured move to $$1,283.02 per ounce." Well, on September 2nd, Gold moved up $21.90 per ounce to close @ $977.10 per ounce, and while it hasn't close yet above $1,002.66 per ounce it has had a couple days with intra-day trades above the $1,000 level. So with Gold obviously moving higher, I thought now would be a good time to look at how we could profit from from the upward movement in the price of Gold.

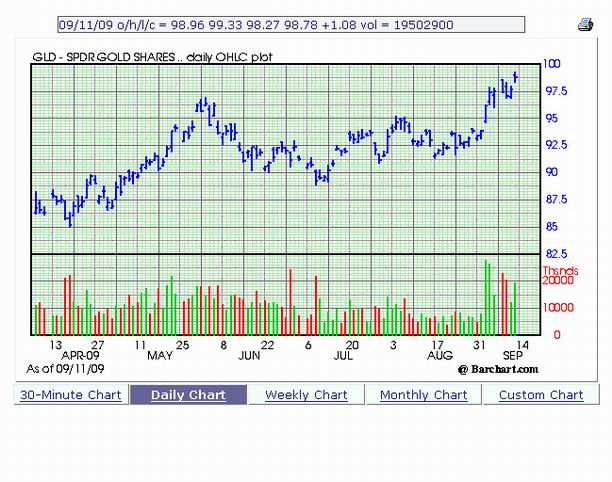
On January 6th, 2006 I published a report titled "A comprehensive Technical Analysis of the Philadelphia Gold & Silver Index 'XAU'." At that point in time there were a limited number of Gold Exchange Traded Funds 'ETS' and the few that existed had only been in existence for about a year. As a result, they had a limited amount of liquidity. Since then a lot has changed. ETF's have developed a much longer track record and a significantly greater amount of liquidity. Back in 2006, I felt that the best way to play the price of Gold was to buy the 'XAU' or components of the 'XAU'. Now I feel the 'XAU' doesn't track the price of Gold accurately enough, and a much better way to play the movement in Gold is to buy a Gold ETF. In reviewing the available information on the various Gold ETF's I feel that the best one to look at is the SPDR Gold Shares 'GLD'. My analysis indicates that this ETF is the most liquid of the Gold ETF's with an average daily trading volume of nearly 19 million shares over the last 30 days, and just over 10.5 million shares per day over the last 90 days. The ETS is priced at approximately 1/10th the price of Gold, making it somewhat economical to trade. Furthermore my analysis indicates that it tracks the price of Gold to within a couple of dollars per ounce. So here are the numbers I am looking at; if the price of Gold hits $1,117.37 per ounce, then the 'GLD' should be priced at approximately $110.38 per ETF share. If the price of Gold hits $1,283.02 per ounce, then the 'GLD' should be priced at approximately $128.34 per ETF share. I've inserted charts of the price of Gold and the 'GLD' below for your comparison. The decision is yours, but if Gold closes above $1,002.66 per ounce, I'll probably buy a few shares of the 'GLD'

Chart of the Price of Gold.
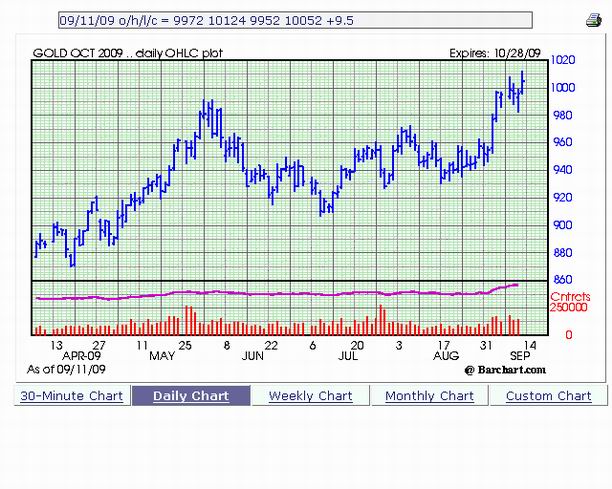
Chart of of Gold Prices through September 11th, 2009Chart of the SPDR GOLD ETF

CHart of the SPDR Gold ETF PS. It is worth noting that we have a fairly heavy economics calendar this week.


Sterling Calendars for the Week of September 14th, 2009
Economic Calendar
Date Est. Time Release

For

Consensus Prior
09/15 8:30am Core PPI Aug 0.1% (0.1%)
09/15 8:30am PPI Aug. 0.8% (0.9%)
09/15 8:30am Retail Sales Aug. 1.9% (0.1%)
09/15 8:30am Retail Sales - Ex Auto Aug. 0.4% (0.6%)
09/15 8:30am Empire Manufacturing Sep. 15.00 12.08
09/15 10:00am Business Inventories July. (0.8%) (1.1%)
09/16 8:30am Core CPI Aug. 0.1% 0.1%
09/16 8:30am CPI AUg. 0.3% 0.0%
09/16 9:00am Net Long Term TIC Flows July N/A ($31.2B)
09/16 9:15am Capacity Utilization Aug. 69.1% 68.5%
09/16 9:15am Industrial Production Aug. 0.7% 0.5%
09/16 10:00am Crude Inventories 09/11 N/A (5.91M)
09/17 8:30am Building Permits Aug. 596K 564K
09/17 8:30am Housing Starts Aug. 580K 581K
09/17 8:30am Initial Claims 09/12 555K 550K
09/17 8:30am Continuing Claims 09/05 6.114M 6.088M
09/17 10:00am Philadelphia Fed Sep. 8.0 4.2


Prime Update:

The Prime Stock Newsletter is our daily newsletter that contains commentary on the overall market, and our single best trading idea for the day! (Both Long & Short Sale Recommendations) We select this stock through a combination of technical (charting) and fundamental (financial) analysis. The Prime Stock Newsletter provides select expanded quotation information, corporate description, select recent company news, our technical analysis of the shares and our expectations, and our options recommendation for the company.

Our most recent Performance Report is now available available (here). 13 of our last 20 recommendation resulted in profitable trades for an average profit of $0.23/share. This is an 65% success rate.

Highlights from Recent (20) Editions of the Prime Stock Newsletter
Recommendation Date Entry Point Recent Close or Exit Price Profit* Note
Hess Corp. 'HES' Short Aug 17 $49.69 $48.48 $1.21 Covered on the Aug. 17th
Petroleo Brasil 'PBR' SHORT Sep 1 $40.05 $38.72 $1.33 Covered on Sept 1st
KLAC Tencor 'KLAC' Sep 10 $33.35 $34.64 $1.29 Sold Sept 11th
* Our August 31st, recommendation of Amphenol Corp. 'APH' @ $35.32/share, set a new yearly high of $38.71 on September 11th.
* Our August 28th recommendation of Time Warner Cable 'TWC' @ $36.93/share, set a new yearly high of $41.47/share on September 11th.
* Our August 13th recommendation of Informatica Corp. 'INFA' @ $19.18/share, set a new yearly closing high of $21.41/share on September 11th.
* Our August 12th, short sale recommendation of Borg Warner 'BWA' reached our stated price target of $30.10/share on August 19th.
* The per share PROFIT is a theoretical calculation based upon the opening price the day the recommendation is published and the intra day high (or low for short sales) on the exit day. The exit day is determined based upon the application of our "Rules for Trading", the implementation of "stops" within our stated policy, and may not reflect the complete or full movement of the underlying recommendation.


Disclaimer: The Sterling Investments series of newsletters is produced by Sterling Investment Services, Inc. All information used in the production has been obtained from sources believed to be reliable and accurate. Sterling Investment Services does not warrant or assume any liability for inaccuracy of the information used to produce our publications. To receive further information on these services please visit our web page at: www.sterlinginvestments.com If you would like to contact us our fax # is (404)-816-8830 Email address is: enelson@sterlinginvestments.com Sterling Investment Services may hold positions in the securities recommended or may be providing consulting services to the companies mentioned within this report.
©1999 - 2009 Copyrighted, All Rights Reserved