Sterling Investment Services for all your stock and options trading needs. Stock Tips

Stock and Option Trading Ideas
 
Loading

Market Data and Free Tools

Markets Overview
Market Momentum
Nada
Commodities
52 Week Highs
52 Week Lows
Volume Leaders
Price Advances
Price Declines
Percent Advances
Percent Declines

Symbol Lookup
Custom Quotes
Custom Portfolio


Free Newsletter

Join our mailing list
and receive our FREE Weekly Newsletter!

subscribe unsubscribe

Interested in reselling the Sterling Investment Services Prime Stock Newsletter or referring subscribers and earning extra income?? (more)

New Features - Coming Soon

Daily Market Commentary Daily Long or Short Stock Recommendation and our option recommendation. Select Fundamental Info. Our Technical Analysis of the Stock!

If you think traders & investors find this information useful then you should be one of our affiliates!


Announcements

Sterling Small Cap Letter.

Sterling Investment Services is now publishing our Small Cap Review newsletter that highlights small and micro cap companies that we should be of interest to our readers. Additional information on the Small Cap. Review can be found (here).


Sterling Custom Research

Sterling Investment Services has recently published a small cap. research report on Sun River Energy, Inc. (SNRV.OB). This is a company that we think has some pretty interesting potential. A copy of our report can be found (here).


www.sterlinginvestments.com


Sterling Weekly for March 2nd, 2009

The overall market as measured by the Dow Jones Industrial Average lost 302.74 points or approximately 4.1% last week; additionally the Dow Jones Industrial Average another 336.91 points or approximately 4.7% in the 1st two trading days of this week. With today's close of 6,726.02 on the Dow Jones Industrial Average it has closed at is lowest level since April of 1997. In looking a chart of the Dow from the mid 90's I see support coming in at 6,547.79 and then 6,391.69. After that, the next level of support in the 6,000 range is at 6,286.35 if that support level fails to hold then we do not see the next level of significant support until around the 5,800 to 5,700 level on the Dow. OUCH. I think there is a realistic chance we will see the Dow Jones Industrial Average at that level (5,800) sometime within the next 60 days.

As I discussed in this morning's Prime Stock Newsletter, there is normally a bull market somewhere at all times, but not this time. I look at roughly 40 different sector indices every day, they pretty much reflect all segments of the US economy. There is not a single sector index that is performing well in the current market environment. Normally the utility companies would be a "safe haven" investment during troubled times, but not this time. The chart below is a chart of the Dow Jones Utility Average. Normally during periods of economic recession the utility stocks, and utility average will out perform the mainstream companies in the stock market, especially the Dow Jones Industrial Average; but not this time. They have pretty much tracked the movement of the overall market lower.

Dow Jones Utility Average (DJ-15)

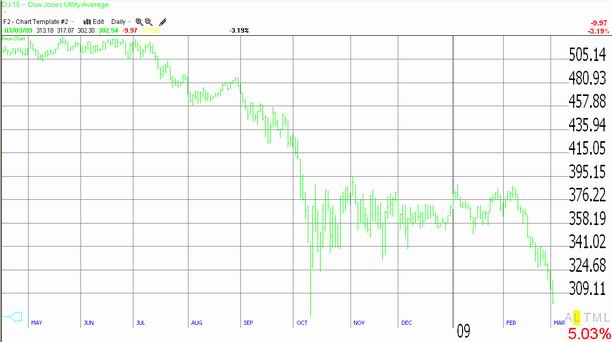
So, one has to legitimately ask "why not this time??? What is different?" Well keep in mind the market is forward looking. It is much more focused on expected future results than what happened in the past. Right now the biggest issue facing the utility companies is the concern over the much discussed Carbon Tax, sometimes called "cap and trade" or sometimes called "tax and trade." There is a limited amount of information available on the subject, but it appears to focus on 2 main points. The 1st being that every emitter of carbon dioxide is going to need to purchase the right to emit CO2. The second is that they will be taxed based upon the amount of CO2 they emit. The goal of the taxation policy is to increase the cost of the carbon based energy production to make Alternative Energy production cost competitive. A recent article I read in the Wall Street Journal suggested that this would cause between a 200-300% increase in electric and gas utility costs. Since it is highly doubtful the public could sustain such an increase in its utility costs, the most likely result would be that the utility companies would not be able to get the necessary regulatory approval to raise their rates and as a result their profits would suffer dramatically. Of course I could be wrong about all this, but you take a look at the chart above and tell me what you think the market is saying about the proposed carbon tax and its effects on the utilities.


Sterling Calendars for the Week of March 2nd, 2009
Economic Calendar
Date Est. Time Release

For

Consensus Prior
03/02 8:30am Personal Income Jan.    
03/03 10:00am Pending Home Sales Jan. (3.5%) 4.8%
03/03 2:00pm Auto Sales Feb.    
03/03 2:00pm Truck Sales Feb.    
03/04 8:15am ADP Employment Change Feb. (630k) (522k)
03/04 10:00am ISM Services Feb. 41.0 42.9
03/04 10:30am Crude Inventories 02/27   717k
03/04 2:00pm Fed. Beige Book      
03/05 8:30am Productivity-Revised Q4 1.6% 3.2%
03/05 8:30am Unit Labor Costs Q4 3.4% 1.8%
03/05 8:30am Initial Claims 02/28 635K 667K
03/05 10:00am Factory Orders Jan .(2.1%) (3.9%)
03/06 8:30am Average Workweek Feb. 33.3 33.3
03/06 8:30am Hourly Earnings Feb. 0.2% 0.2%
03/06 8:30am NonFarm Payrolls Feb. (650k) (589k)
03/06 8:30am Unemployment Rate Feb. 7.9% 7.6%
03/06 2:00om Consumer Credit Jan. ($5.0b) ($6.6b)

  Misc. Calendar
Date: Comments:
03/04 GP Strategies 'GPX' announces earnings. Time N/A. Est. $0.18
03/04 Toll Bros. 'TOL' announces earnings. Time N/A. Est. ($0.41)
03/05 Union Drilling 'UDRL' announces earnings after the close. Est. $0.14
03/06 AnnTaylor Stores 'ANN' announces earnings at 8:00am Est. ($0.55)
  The full earnings calendar for this week can be found (here)

Prime Update:

Sterling Investment Services is an investment research and money management firm publishing the Prime Stock Newsletter. The Prime Stock Newsletter is a daily comprehensive newsletter that is useful for investors and traders alike. Whether you are looking for short term trading opportunities ranging from day trading to a couple of weeks or if you looking to acquire a long term portfolio at smart entry points. Subscriptions are $50/month. A Free 2 Week Trial is currently being offered.

Our most recent Performance Report is now available available (here). 14 of our last 20 recommendation resulted in profitable trades for an average profit of $1.13/share. This is an 70% success rate.

Highlights from Recent editions of the Prime Stock Newsletter
Recommendation Date Entry Point Recent Close or Exit Price Profit* Note
Devon Energy 'DVN'' Short Sale

Jan 20

$57.67 $54.53 $3.14 Covered on the 20th
Aetna 'AET' Jan 28 $32.03 $34.39 $2.36 Sold on the 28th.
Eli Lilly 'LLY' short sale Feb 13 $36.15 $27.49 $8.66 Still Open

Raytheon 'RTN' Short sale

Feb 26 $43.37 $36.45 $6.92 Still Open
* The per share PROFIT is a theoretical calculation based upon the opening price the day the recommendation is published and the intra day high (or low for short sales) on the exit day. The exit day is determined based upon the application of our "Rules for Trading", the implementation of "stops" within our stated policy, and may not reflect the complete or full movement of the underlying recommendation.

Dow Jones Industrial Average (INDU)

Current Opinion: Closed @ 6,726.02 Last Signal: Called Lower (again) with the close of 8,378.95 on October 24th. Current Expectations: We might see a short term rally however the Dow should continue to move lower and test 6,547.79 and then 6,391.69 on a closing basis.


The S&P 500

Current Opinion: Closed @ 696.33 Last Signal: Called Lower (again) with the close of 876.77 on October 24th. Current Expectations: We might see a short term rally however the S&P 500 should continue to move lower and test 680.54 on a closing basis.


The NASDAQ 100 (NDX)

Current Opinion: Closed @ 1,080.67 Last Signal: Called Lower (again) with the close of 1,202.27 on October 22nd. Current Expectations: The NDX should continue to move lower and test 1,036.51 on a closing basis.


CBOE Ten Year Treasury Index (TNX)

Current Opinion: Closed @ 2.938% Current Expectations: The TNX should move higher and test 3.027% and then 3.340% on a closing basis.


Disclaimer: The Sterling Investments series of newsletters is produced by Sterling Investment Services, Inc. All information used in the production has been obtained from sources believed to be reliable and accurate. Sterling Investment Services does not warrant or assume any liability for inaccuracy of the information used to produce our publications. To receive further information on these services please visit our web page at: www.sterlinginvestments.com If you would like to contact us our fax # is (404)-816-8830 Email address is: enelson@sterlinginvestments.com Sterling Investment Services may hold positions in the securities recommended or may be providing consulting services to the companies mentioned within this report.
©1999 - 2008 Copyrighted, All Rights Reserved