Sterling Investment Services for all your stock and options trading needs. Stock Tips

Stock and Option Trading Ideas
 
Loading

Market Data and Free Tools

Markets Overview
Market Momentum
Nada
Commodities
52 Week Highs
52 Week Lows
Volume Leaders
Price Advances
Price Declines
Percent Advances
Percent Declines

Symbol Lookup
Custom Quotes
Custom Portfolio


Free Newsletter

Join our mailing list
and receive our FREE Weekly Newsletter!

subscribe unsubscribe

Interested in reselling the Sterling Investment Services Prime Stock Newsletter or referring subscribers and earning extra income?? (more)

New Features - Coming Soon

Daily Market Commentary Daily Long or Short Stock Recommendation and our option recommendation. Select Fundamental Info. Our Technical Analysis of the Stock!

If you think traders & investors find this information useful then you should be one of our affiliates!


Announcements

Sterling Small Cap Letter.

Sterling Investment Services is now publishing our Small Cap Review newsletter that highlights small and micro cap companies that we should be of interest to our readers. Additional information on the Small Cap. Review can be found (here).


Sterling Custom Research

Sterling Investment Services has recently published a small cap. research report on Sun River Energy, Inc. (SNRV.OB). This is a company that we think has some pretty interesting potential. A copy of our report can be found (here).


www.sterlinginvestments.com


Sterling Weekly for the Week of January 11th, 2010
The Possibility of Higher Interest Rates, and How to Profit from Them

Since the previous edition of the Sterling Weekly, the Dow Jones Industrial Average rose 190.14 points, or approximately 1.8%, to finish at 10,618.19 In last week's edition of the Sterling Weekly I looked at the various sector indices I track and how they had performed over the course of the last year and the decade as a whole. Absent from my discussion was the interest rate indices. I purposely left them out of the discussion due to their inherent differences from a stock index, the average person cannot buy or short an interest rate index. Additionally interest rate indices do not represent something that actually grows, they are basically designed to reflect the rate of interest on bonds with a specific amount of time until maturity; and as a result on a longer term basis they basically fluctuate above and below the long term average rate of interest for bonds with that specified maturity rate.

Another way of looking at this is when interest rates are at one extreme or another, they are most likely to regress towards the mean, or in other words reverse course and move back towards the long term average. But like most things that swing back in forth, when they move back towards the average they don't just stop at the average once they reach it, they keep moving past the average until they reverse course again and head back towards the average. Just think of the pendulum on a Grandfather Clock. Also, like the pendulum on a clock, the greater the swing to one extreme, the greater the swing is likely to be when it moves past the average.

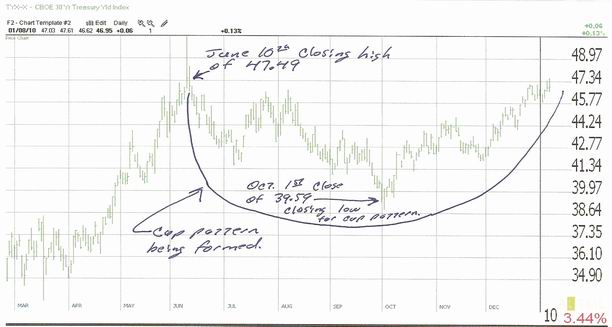
One of the key measures of interest rates is the CBOE 30-Year Treasury Bond Index 'TYX' which closed last week at 46.95 representing a yield on a 30-Year Treasury Bond of 4.965%. I've included the recent chart on the 'TYX' below and it is clear to see that the 'TYX' is closing in on 47.49, the post crisis closing high set back on June 10th, 2009. This is significant because a close by the 'TYX' above that level would complete a "cup pattern" with a measured move to 57.39 or a yield of 5.739% on the 30-Year Bond. Additionally, while I believe the recent large purchases of Treasury Instruments by the Fed is a form of market manipulation on their part to keep interest rates low, I also believe that the 30-Year Treasury bond is also more directly under the influence of long term market forces than the other Treasury instruments.

CBOE 30-Year Treasury Index

I think this is significant for two (2) reasons. The 1st being that if longer term rates rise as I expect, then the value of long term Treasury instruments is going to decline dramatically; and secondly because in the overall scheme of things this could very easily be just the beginning of a long term cyclical move higher by interest rates.

Now the question becomes how to play the move higher in interest rates? There are two (2) exchange traded funds designed to move inverse to longer term interest rates that I like. Both are from ProShares a sponsor of over 90 different ETFs. The 1st is the Proshares Short 20+ Year Treasury ETF 'TBF', and for the more aggressive traders the Proshares UltraShort 20+ Year Treasury ETF 'TBT'. Personally, I prefer the 'TBF' to the 'TBT' because the lack of leverage allows it to better track the movement 'TYX' than the 'TBT' does. Additionally I would like to point out that the 'TBF' closed Friday at $50.82/share, and the 'TBT' closed Friday at $50.63/share. I feel that either one of these, depending upon your risk tolerance, is an effective way to profit from rising interest rates.

I would like to point out that the government is set to release Consumer Price Index (CPI) data on Friday. Depending upon your source, it looks like the year over year change in the CPI is somewhere between 1.8% to 2.3%. If this week's release shows continued upward movement in the CPI, then look for additional upward pressure on long term interest rates.


Sterling Calendars for the Week of January 11th, 2010.
Economic Calendar
Date Est. Time Release

For

Consensus Prior
01/12 8:30am Trade Balance Nov. ($34.5B) ($32.9B)
01/13 10:30am Crude Inventories 01/08 N/A 1.33M
01/13 2:00pm Treasury Budget Dec. ($92.0B) ($120.3B)
01/13 2:00pm Fed's Beige Book      
01/14 8:30am Initial Claims 01/09 433K 434K
01/14 8:30am Continuing Claims 01/02 4,800K 4,802K
01/14 8:30am Retail Sales Dec. 0.5% 1.3%
01/14 8:30am Retail Sales Ex-Auto Dec. 0.3% 1.2%
01/14 8:30am Export Prices Ex-Ag. Dec. N/A 0.7%
01/14 8:30am Import Prices Ex-Oil Dec. N/A 0.4%
01/14 10:00am Business Inventories Nov. 0.2% 0.2%
01/15 8:30am Core CPI Dec. 0.1% 0.0%
01/15 8:30am CPI Dec. 0.2% 0.4%
01/18 8:30am Empire Manufacturing Survey Jan. 11.25 2.55
01/15 9:15am Capacity Utilization Dec. 71.8% 71.3%
01/15 9:15am Industrial Production Dec. 0.6% 0.8%
01/15 9:55am Michigan Sentiment Jan. 73.8 72.5

Prime Update:

The Prime Stock Newsletter is our daily newsletter that contains commentary on the overall market, and our single best trading idea for the day! (Both Long & Short Sale Recommendations) We select this stock through a combination of technical (charting) and fundamental (financial) analysis. The Prime Stock Newsletter provides select expanded quotation information, corporate description, select recent company news, our technical analysis of the shares and our expectations, and our options recommendation for the company.

Our most recent Performance Report is now available available (here). We are proud to report 17 of our last 20 recommendation resulted in profitable trades for an average profit of $0.62/share. This is an 85% success rate.

Archived copies of our Performance Reports can be found (here).

Highlights from Recent (20) Editions of the Prime Stock Newsletter
Recommendation Date Entry Point Recent Close or Exit Price Profit* Note
Murphy Oil 'MUR' short Dec 8 $54.46 $52.55 $1.91 Covered on the 9th
Southwestern Energy 'SWN' short Dec 9 $41.77 $39.76 $2.01 Covered on the 9th
Travelers Co. 'TRV' short Dec 17 $49.50 $47.89 $1.61 Covered on the 18th
Patriot Coal 'PCX' Dec. 23 $14.90 $17.24 $2.34 Sold on the 28th

* Our December 23rd recommendation of Patriot Coal 'PCX' @ $14.90/share, set a new yearly closing high of $20.42/share on January 8th for a gain of $5.52/share.

* Our December 10th recommendation of US. Steel 'X' @ $46.74/share, set a new yearly closing high of $65.34/share on January 8th for a gain of $18.60/share.

* Our November 19th short sale recommendation of JC Penny 'JCP' @ $29.15/share reached our stated target of $27.15/share on December 18th for a gain of $2.00/share.

* Our November 12th recommendation of Western Digital Corp. 'WDC' @ $38.53/share set a new yearly closing high of $46.46/share on January 5th for a gain of $7.93/share.

* The per share PROFIT is a theoretical calculation based upon the opening price the day the recommendation is published and the intra day high (or low for short sales) on the exit day. The exit day is determined based upon the application of our "Rules for Trading", the implementation of "stops" within our stated policy, and may not reflect the complete or full movement of the underlying recommendation.


Disclaimer: The Sterling Investments series of newsletters is produced by Sterling Investment Services, Inc. All information used in the production has been obtained from sources believed to be reliable and accurate. Sterling Investment Services does not warrant or assume any liability for inaccuracy of the information used to produce our publications. To receive further information on these services please visit our web page at: www.sterlinginvestments.com If you would like to contact us our fax # is (404)-816-8830 Email address is: enelson@sterlinginvestments.com Sterling Investment Services may hold positions in the securities recommended or may be providing consulting services to the companies mentioned within this report.
©1999 - 2010 Copyrighted, All Rights Reserved